Overview
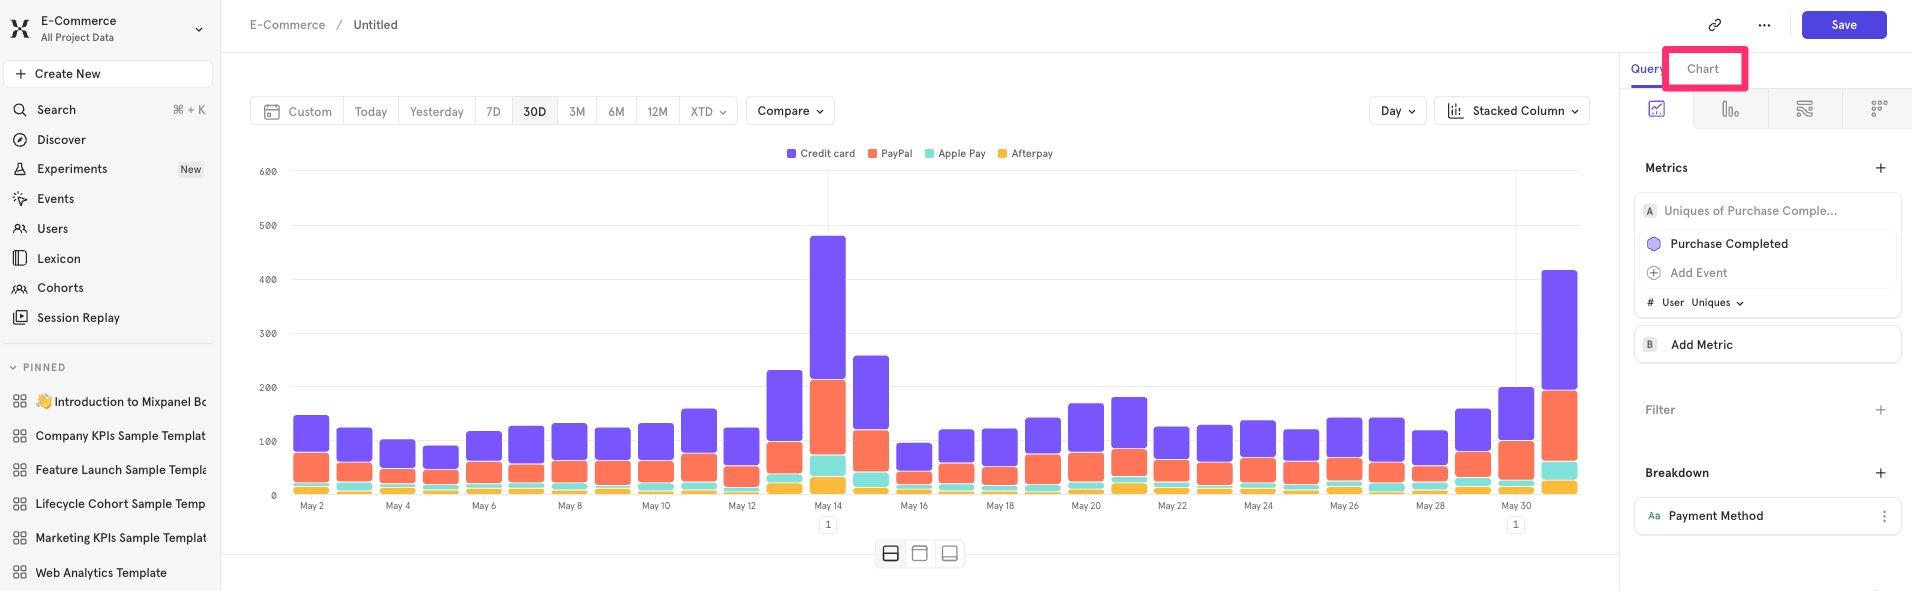
Chart customization allows you to have finer grain control in how you want to visualize your charts in Mixpanel. You can customize the color theme of the visualization, as well as control the axis boundaries, axis labels, choose to use a secondary y-axis, and more. You are able to save these changes to your report and your board so you can present a clearer picture of what is happening with your data.Axis Customization
Axis customization is available for all visualizations with a y-axis. The supported visualization types are:- Line
- Stacked Line
- Column
- Stacked Column
- Funnel Steps
- Retention Curve
Left & Right Y-Axis
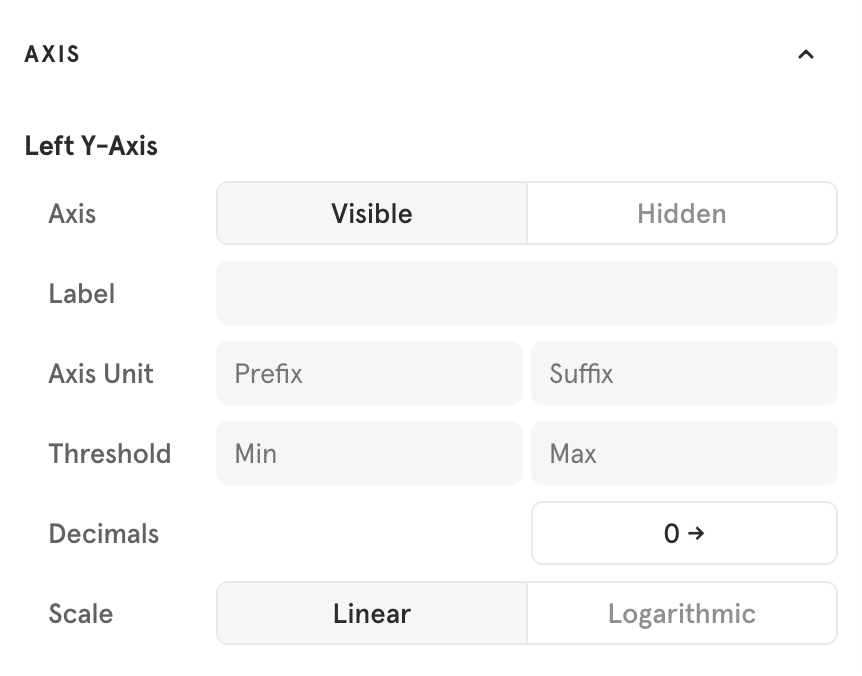
- Visibility: “Visible” or “Hidden”. Use this to visually hide the axis. Note that axis and its bounds still apply, it is only the axis guides that is hidden. Use this to really focus on the trend.
- Label: The y-axis label
- Axis Unit: Displays a unit for the axis markers. You can choose to denote a prefix or suffix for the unit.
- Threshold: The minimum and maximum value for the axis. Use this to set an explicit range to zoom in or out for your trend.
- Decimals: Configures the number of decimals places to show for marker values on the axis. Configurable from 0 to 8.
- Scale: “Linear” or “Logarithmic”. Use this to more clearly show trends for exponential data.
X-Axis
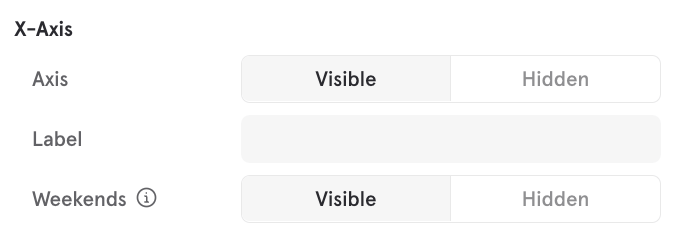
- Visibility: “Visible” or “Hidden”. Use this to visually hide the x-axis.
- Label: the x-axis label
- Weekends: “Visible” or “Hidden”. Use this to visually hide weekends from Line and Column charts.
- Weekend days are determined by your project’s weekend settings.
- This is a visual change only - alerts and aggregations (such as average, max, or sum) are not affected.
- Annotations from hidden weekends are grouped with the datapoint just before the weekend.
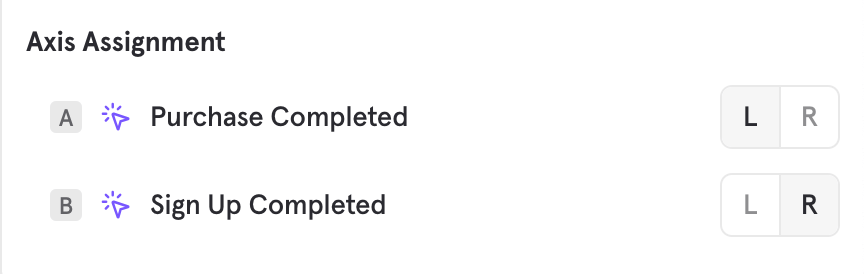
Axis Assignment
Metric Units
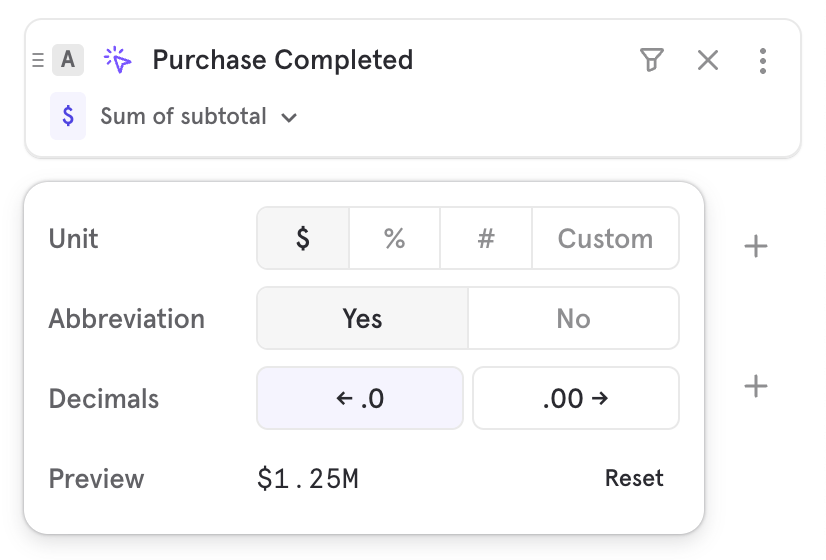
- Unit: choose from the presets, or choose custom to choose any unit for your metric. For certain metrics like conversion rate, Mixpanel will default to the appropriate unit
- Abbreviation: choose whether or not the result should be abbreviated. Useful for large numbers
- Precision: choose how much decimal precision should appear for values
Units on Formula
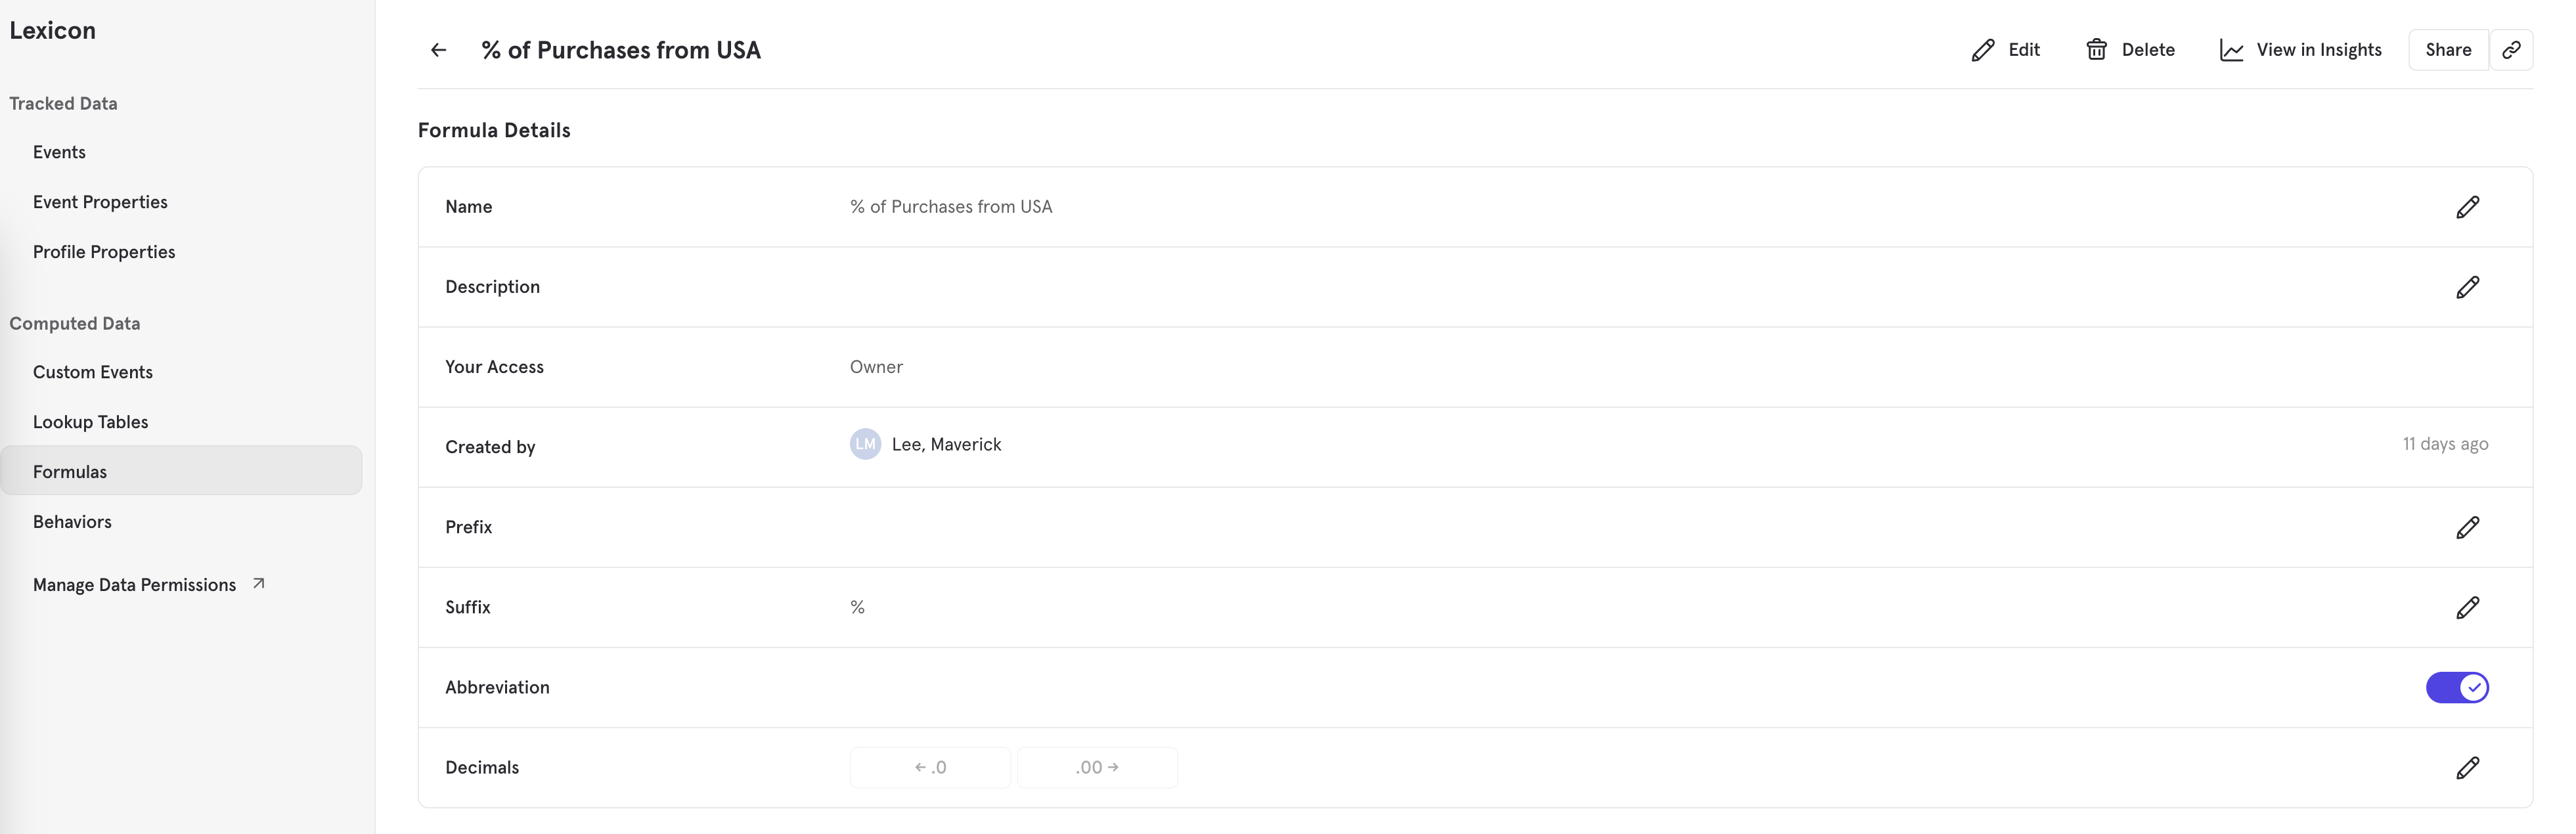
% unit is saved to this formula. Any future usage of this formula across all reports will automatically use the % unit.
Units on Numeric Properties
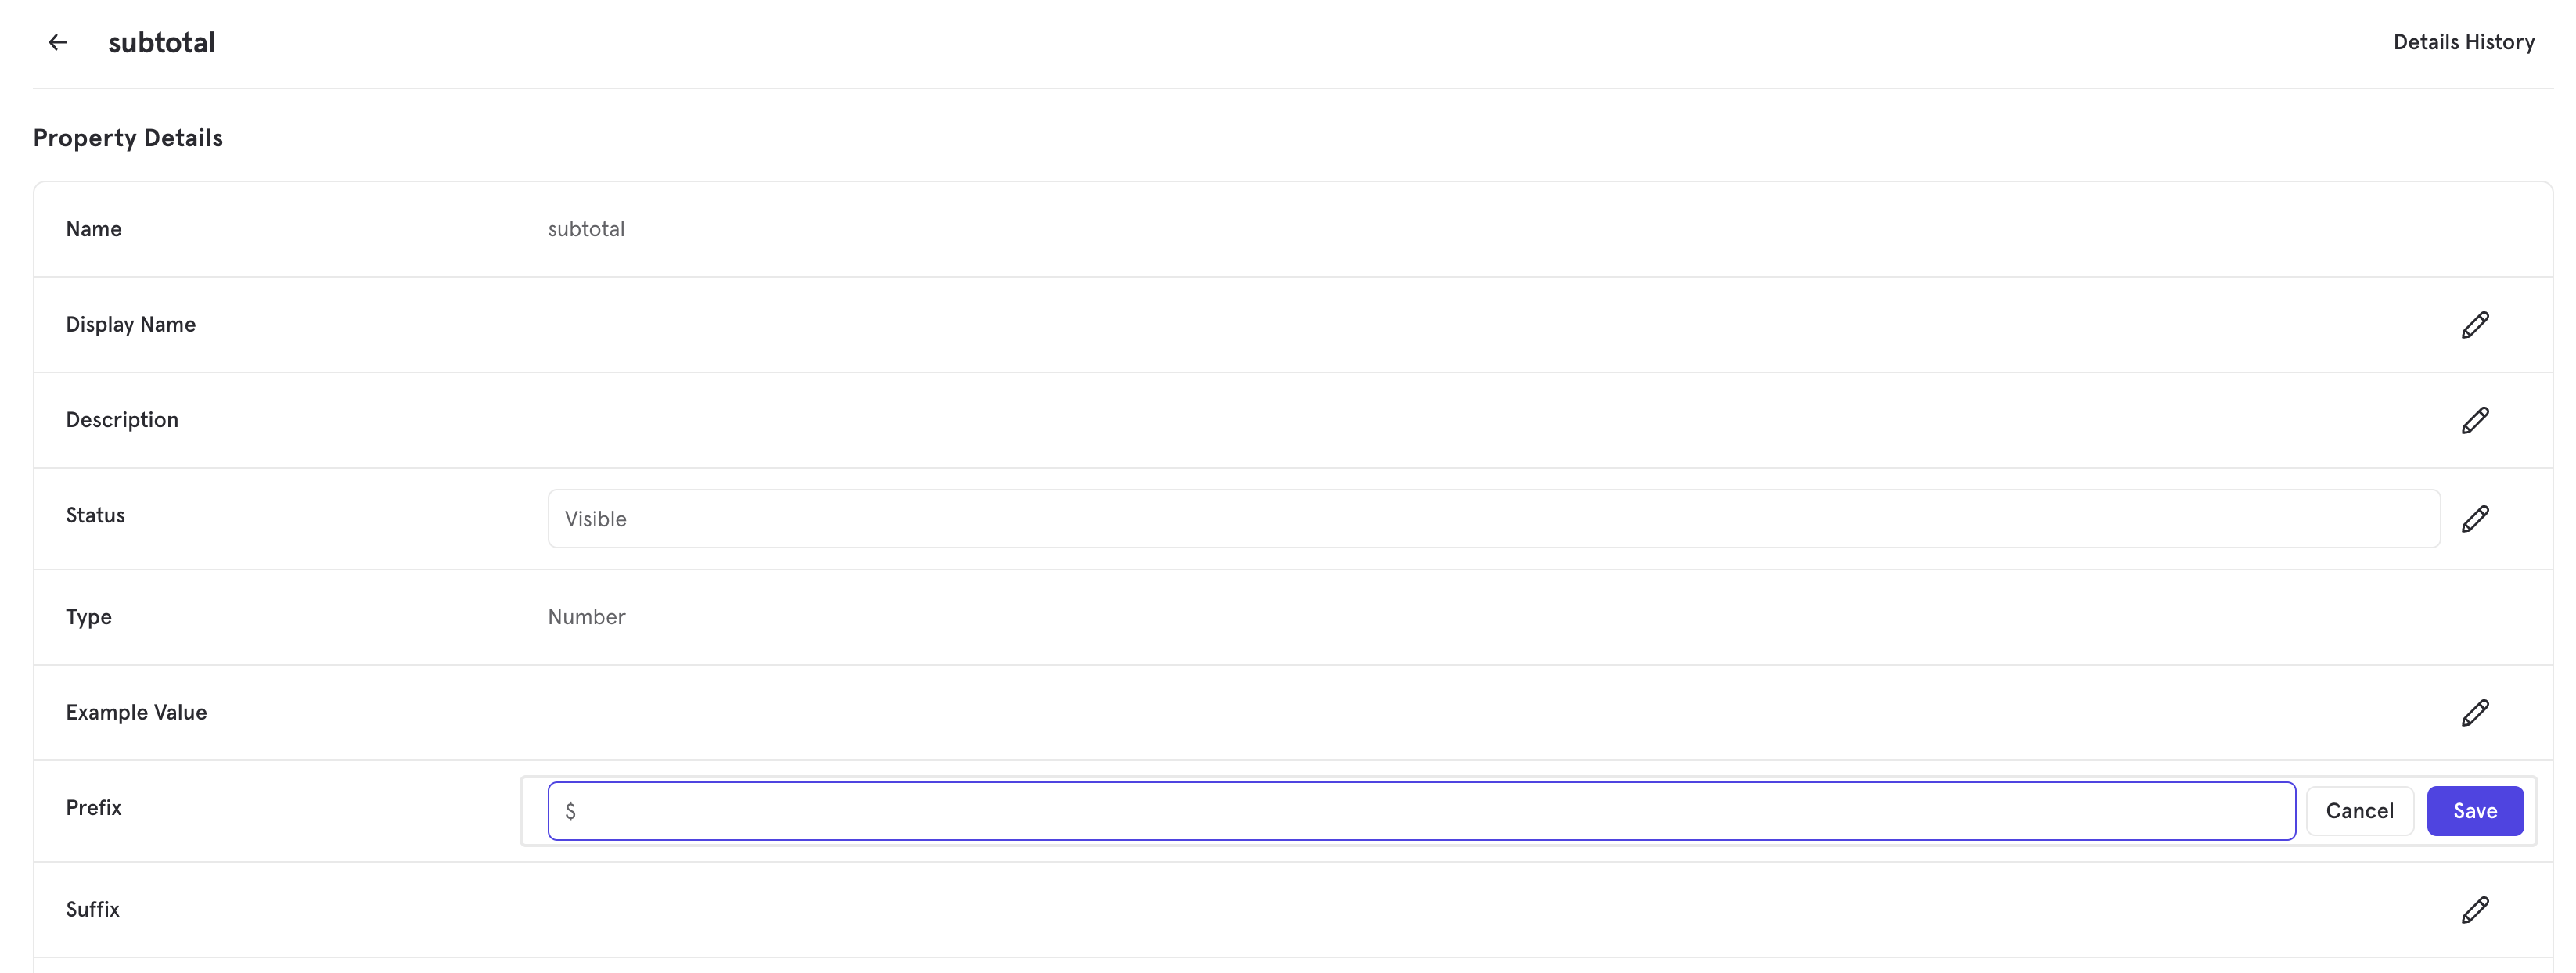
price property that you know is in $. You can set this, and any future usage of this property in measurements will default to using $ so this no longer needs to be set on every usage.
Theme Customization
Availability
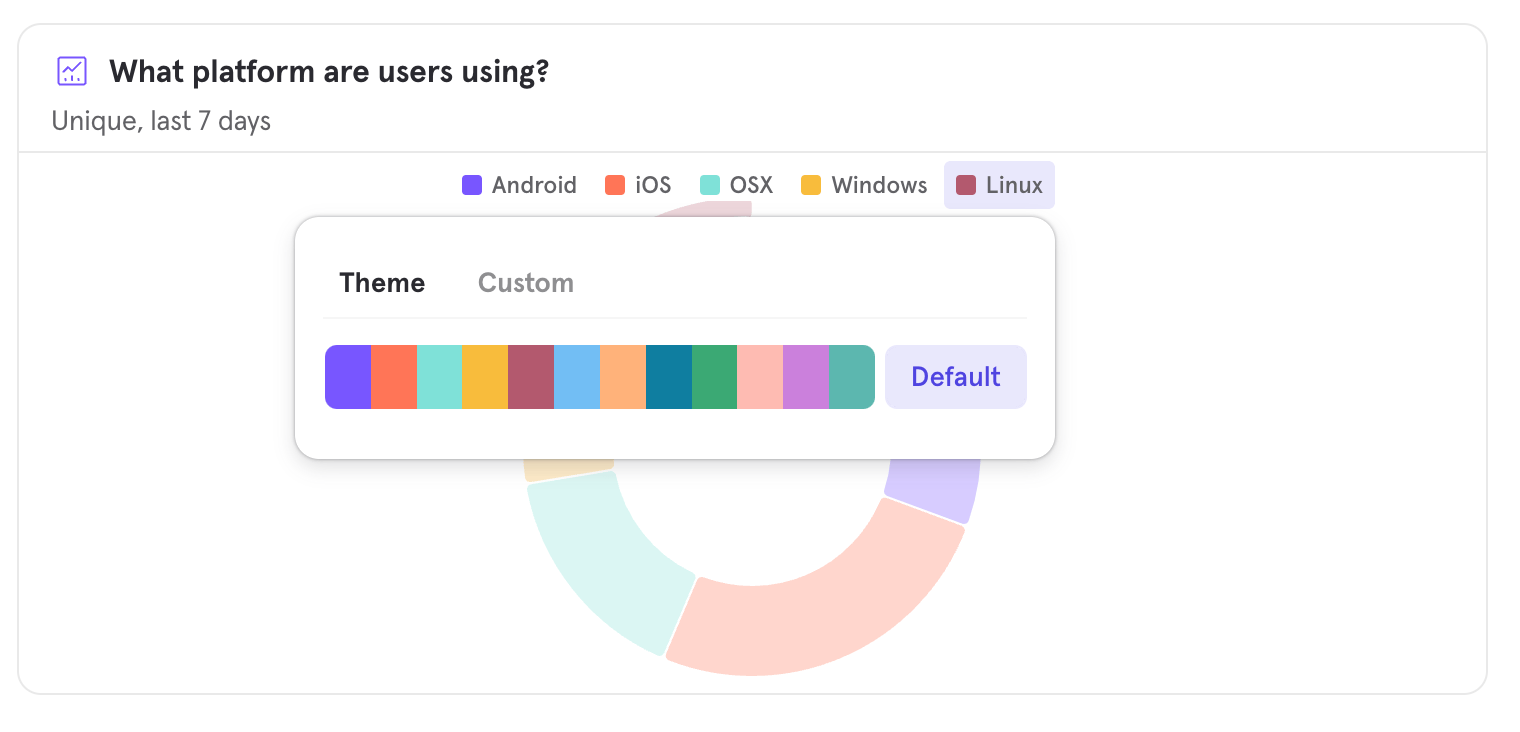
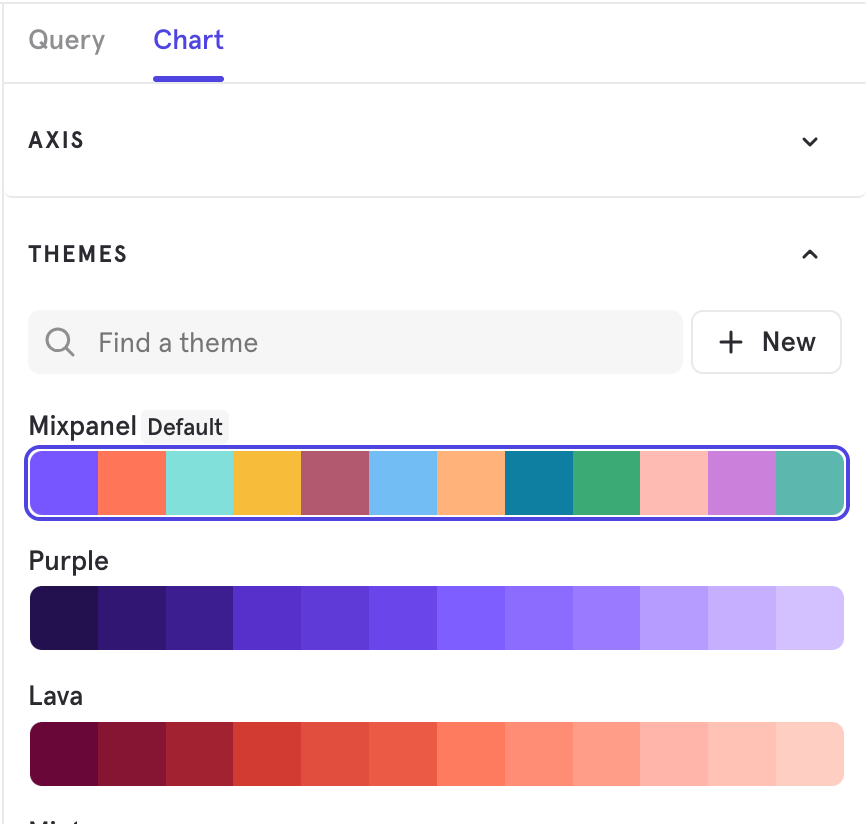
Currently, theme and color customization is available only for customers on our Enterprise plan.Selecting a Theme
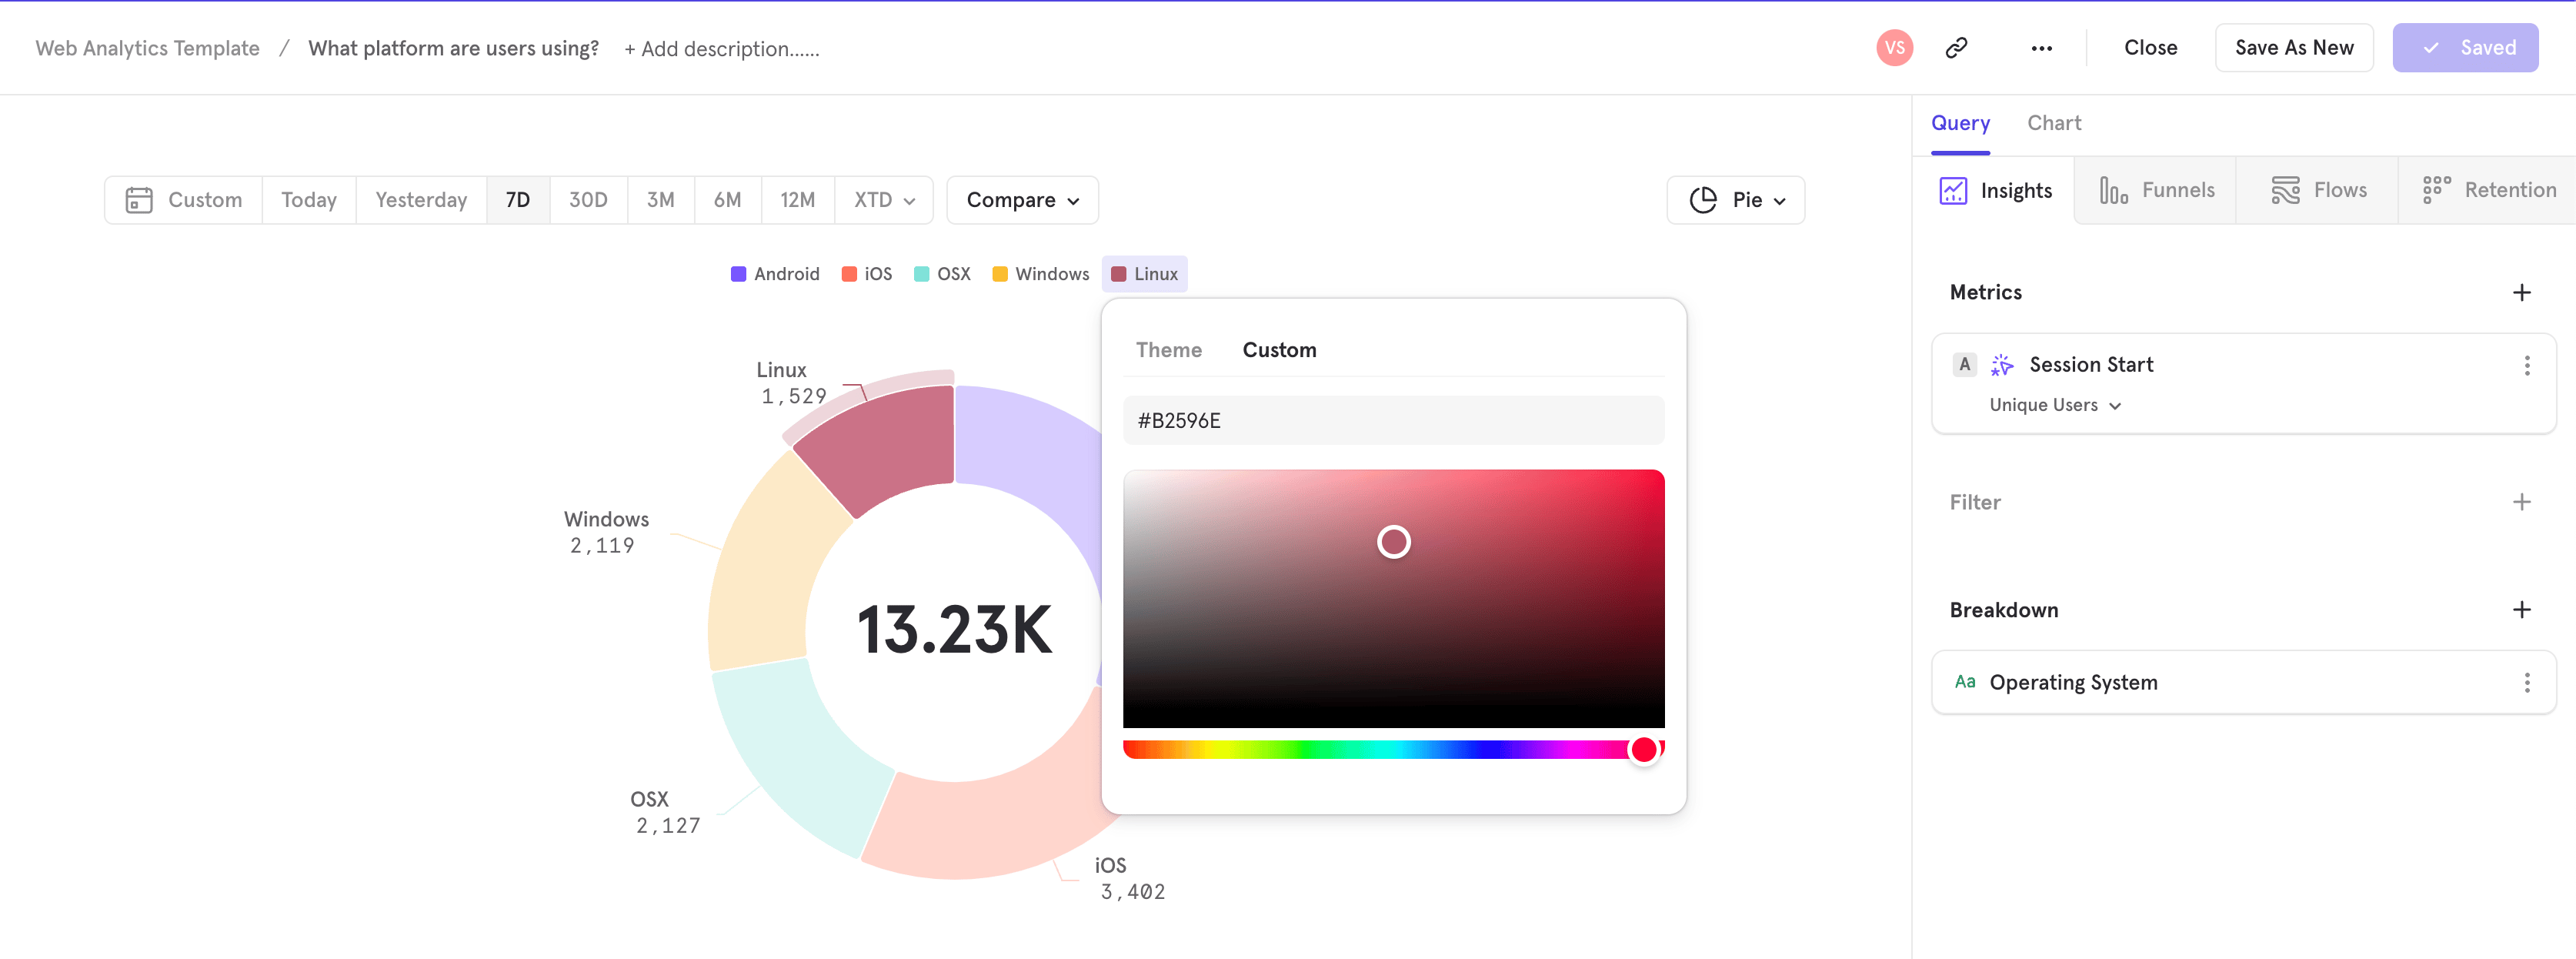
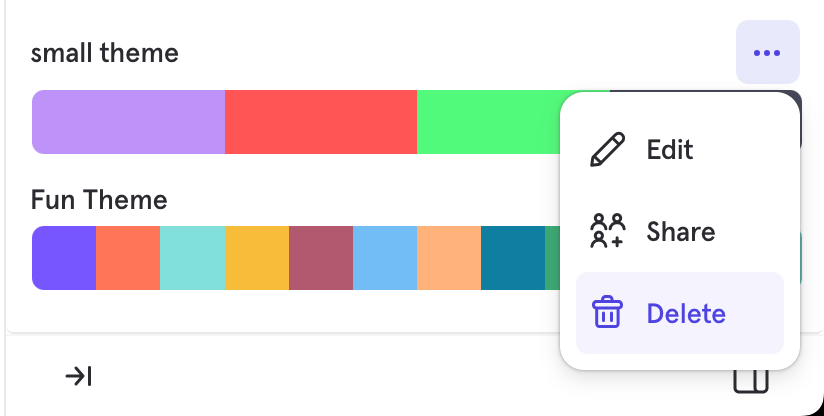
Creating & Editing a Theme
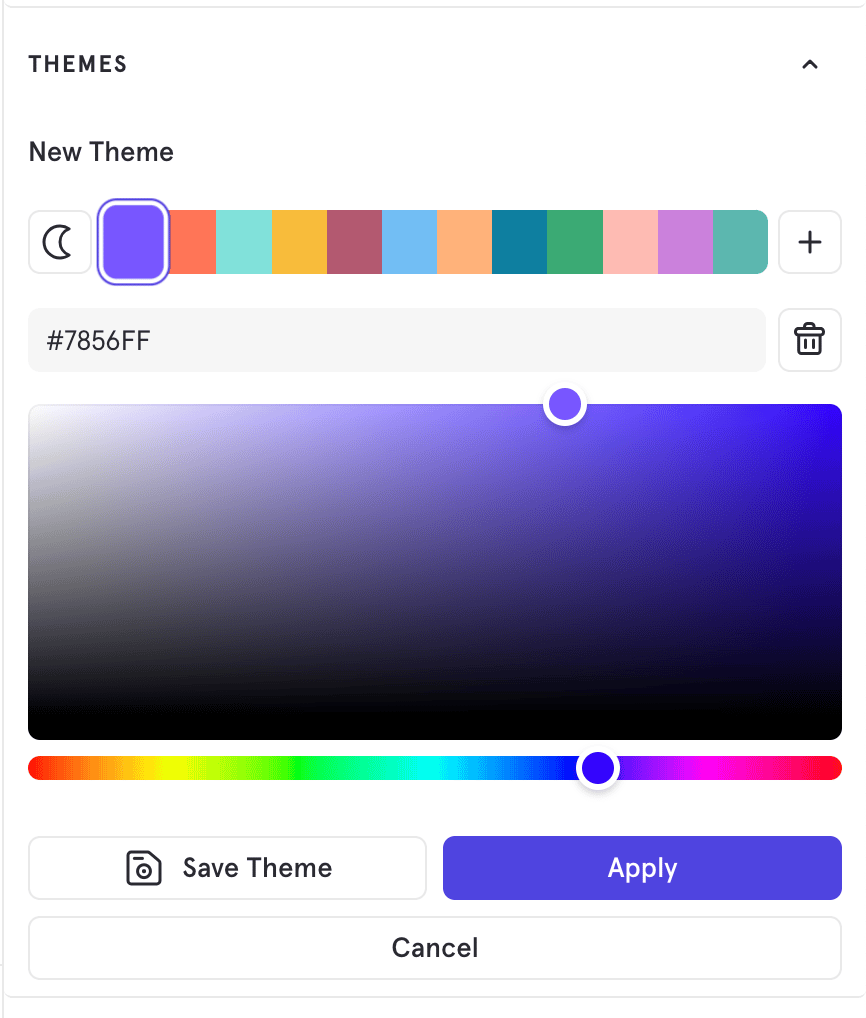
- selecting a color in the theme, then typing in a color hex code, or using the color picker to select the color
- pressing the “plus” button to add an additional color to the theme
- pressing the “trashcan” button to remove a color from the theme
- press the “sun” or “moon” icon to switch between light/dark mode to adjust the theme in each mode
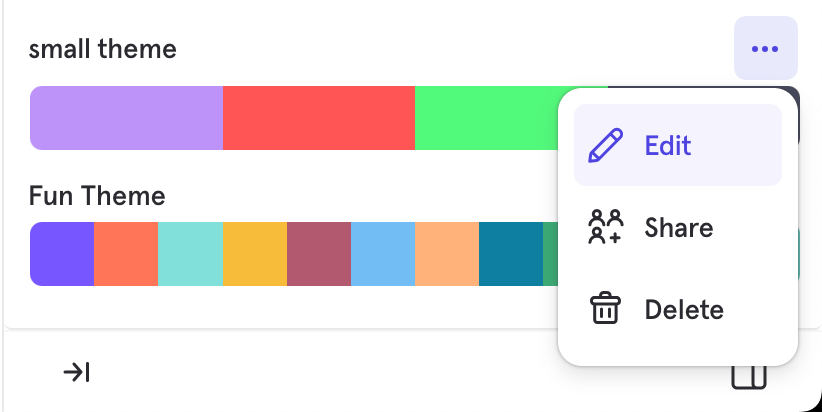
Saving a Theme
After creating or making modifications to a theme, select “Save Theme”.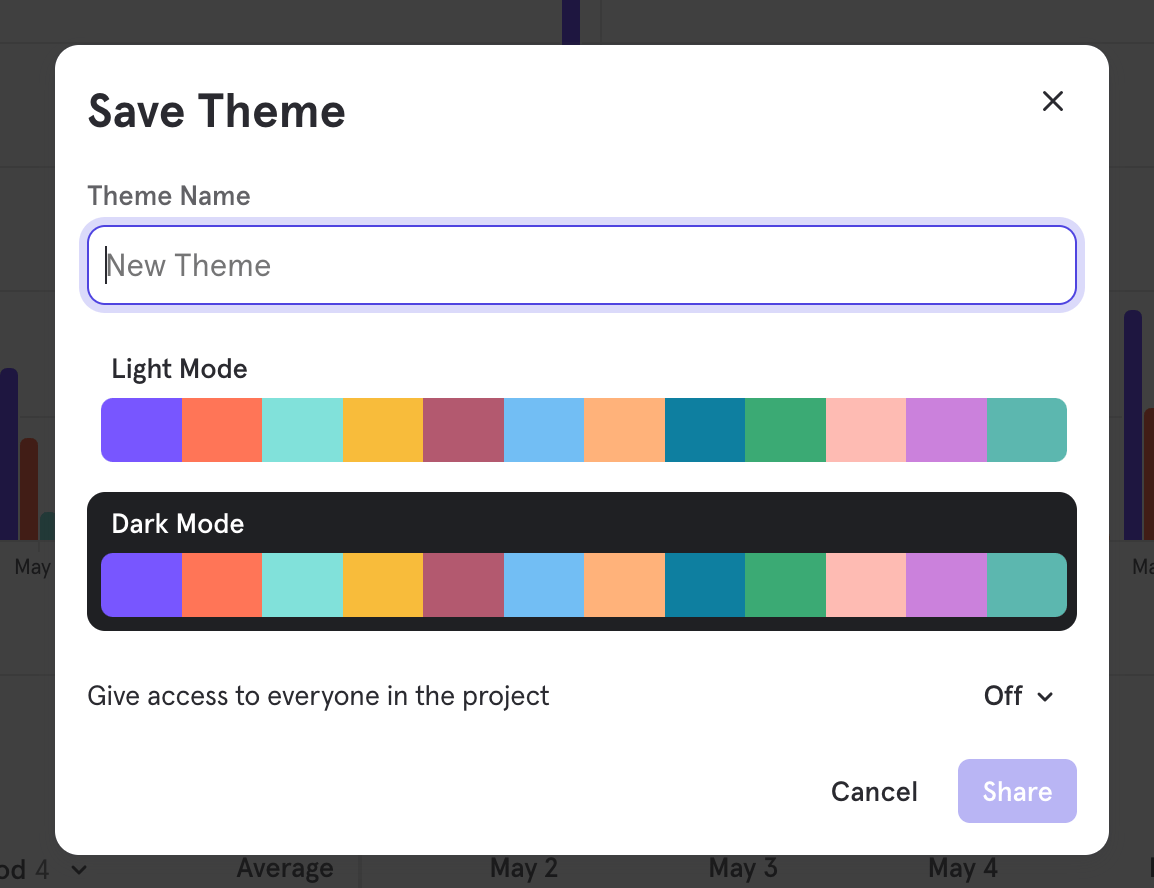
Deleting a Theme
Setting a Project Default Theme

Segment Coloring