Overview
The Flows report is available on all free and paid subscription plans.
Use Cases
Here are some of the sample questions you can answer in Flows:- What did users do immediately after signing up?
- What are the most common sets of actions taken after opening the app?
- What actions lead up to creating a channel?
- How do users navigate between account creation and sending their first message?
Quick Start
What are the top paths leading Chrome users from Landing Page to Sign Up?
Step 1: Choose Events
Events are the basic building block of a Flow. In this case, since we want to know how users navigated from the landing page, to signing up, we would add two events, “Landing Page” and “Sign Up” within the “Steps” section.Step 2: Choose Steps Before/After Events
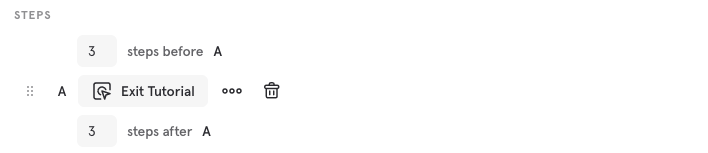
Above and below your selected events, you can choose how many steps to show before and after each event, respectively. In this case, we’re curious to see at least 3 steps after our first selected event, so we input “3” below “Landing Page.” At this point, your query should look like this: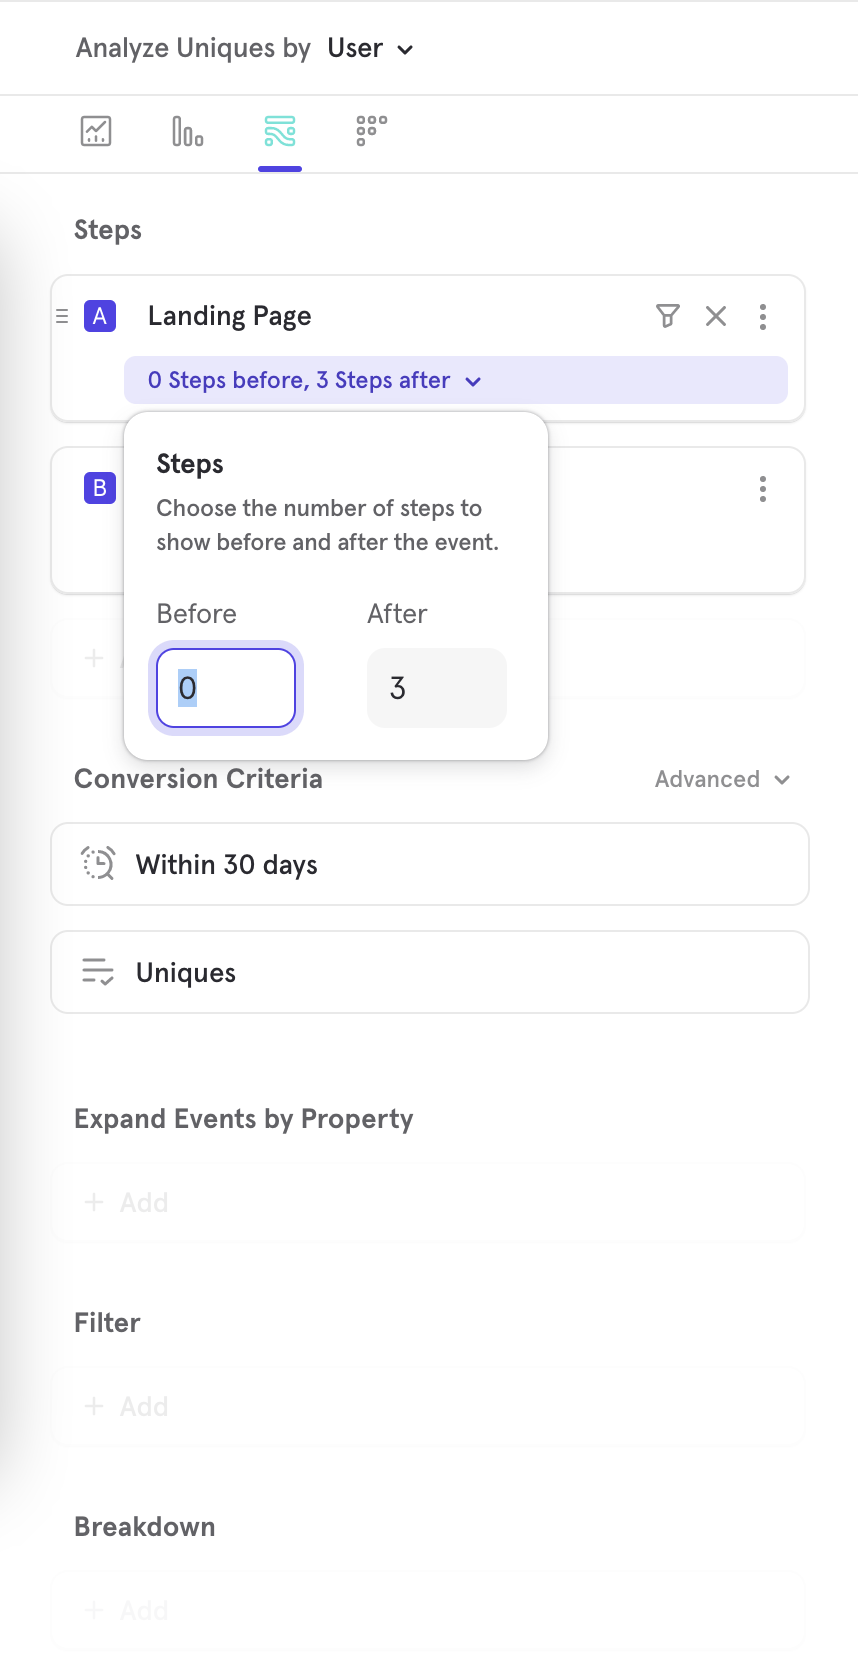
Step 3: Choose Filters
Filters exclude unwanted data. In this case, we only care about events performed by Chrome users. Therefore, add a “Browser” filter, where Browser equals “Chrome”. At this point, your query should look like this: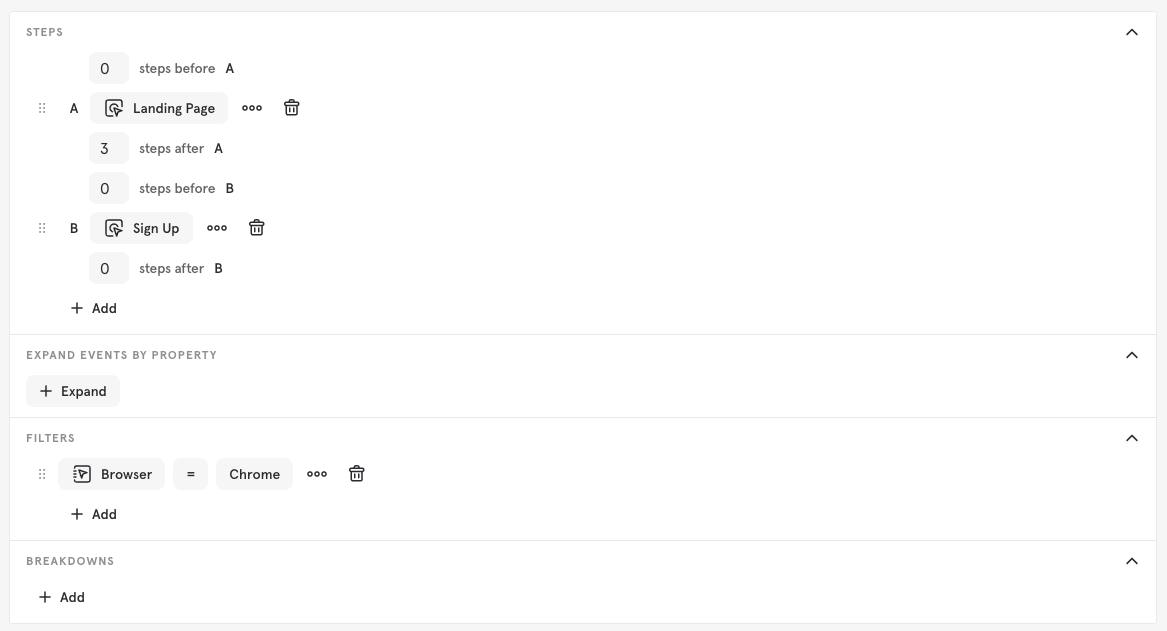
Step 4: Expand The Events
Transforms a high-level view of certain flow step into a more granular, segmented analysis at any given point However, e.g. if we wanted to see how the flow varies by city for a “Check Out” event, we could expand the “Check Out” event by “City”, which can either be an event property or user profile property.Step 5: Choose Breakdowns
The “Breakdown” feature in Mixpanel’s Flows report helps you understand how the complete user journey differs for various segments of your audience. What it does: Instead of seeing one combined flow for all users, “Breakdown” separates the report into multiple, parallel flows. This lets you clearly compare the entire user journey (from entry to exit or drop-off) for specific groups, helping you identify where their paths diverge and where you might need to optimize for different audiences.Step 6: Analyze Results
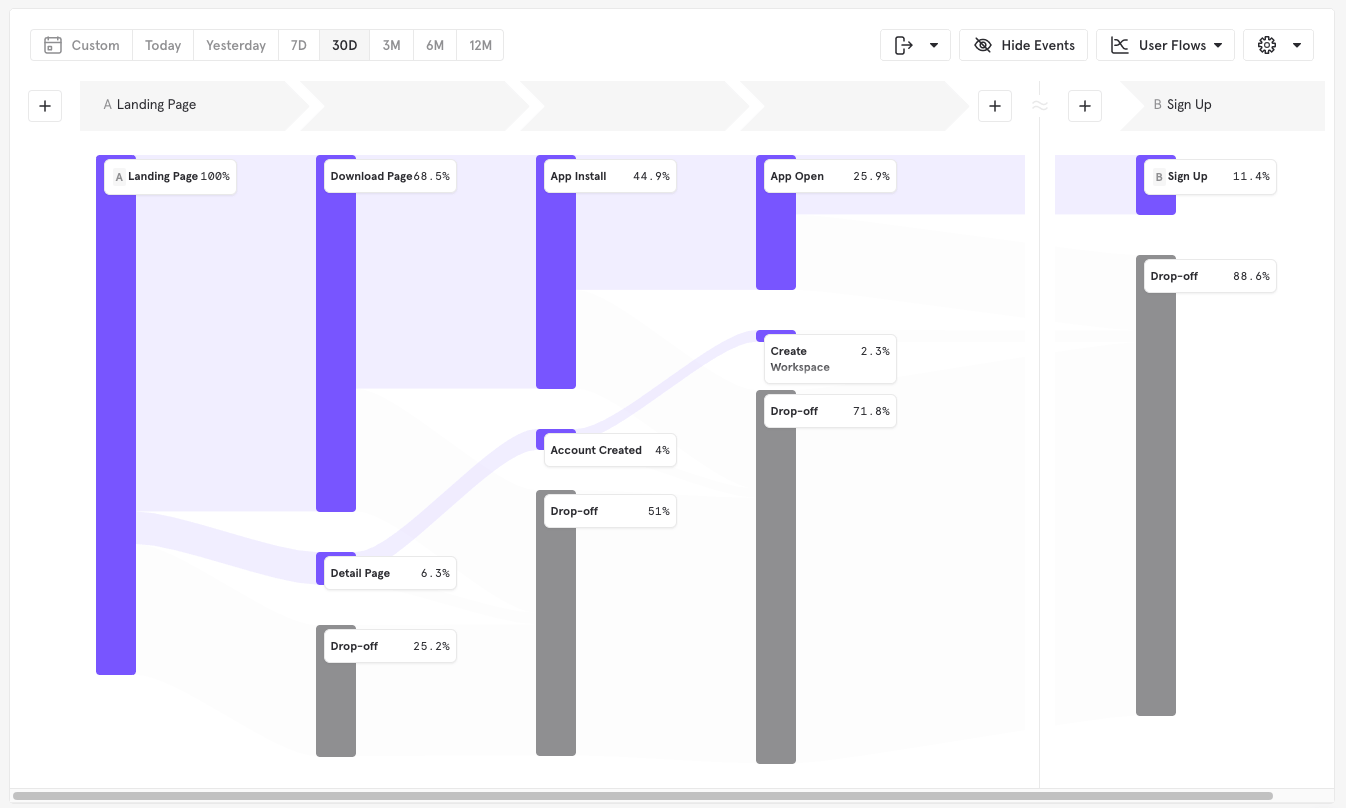
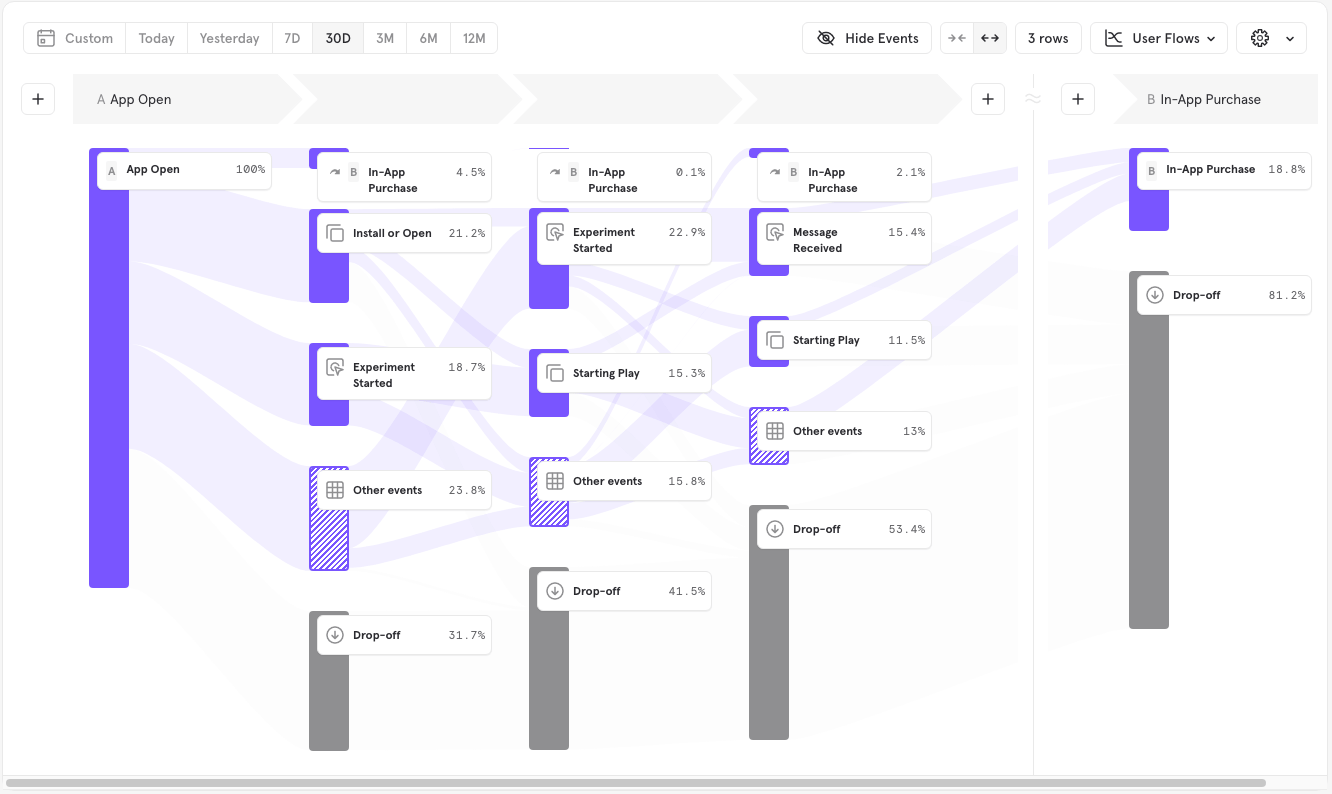
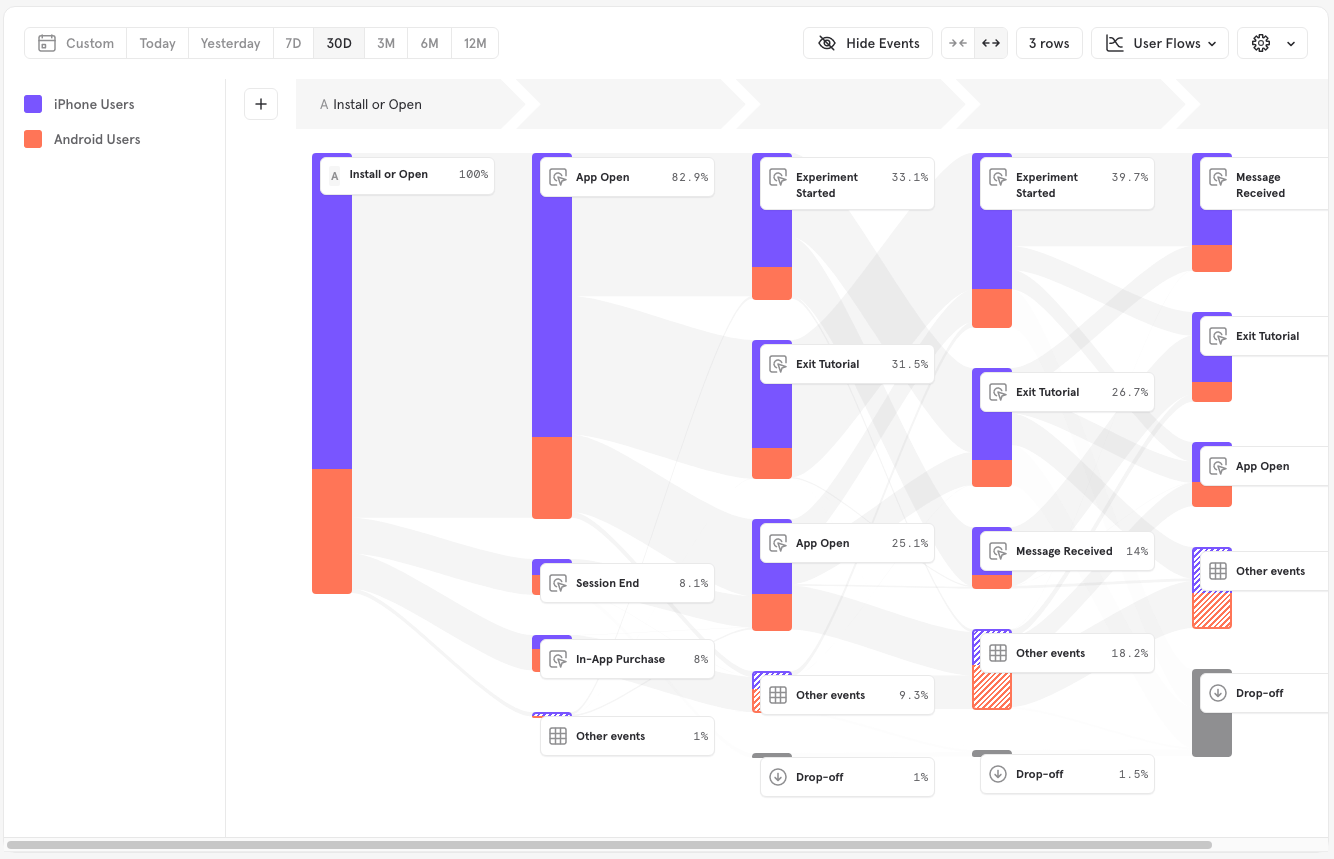
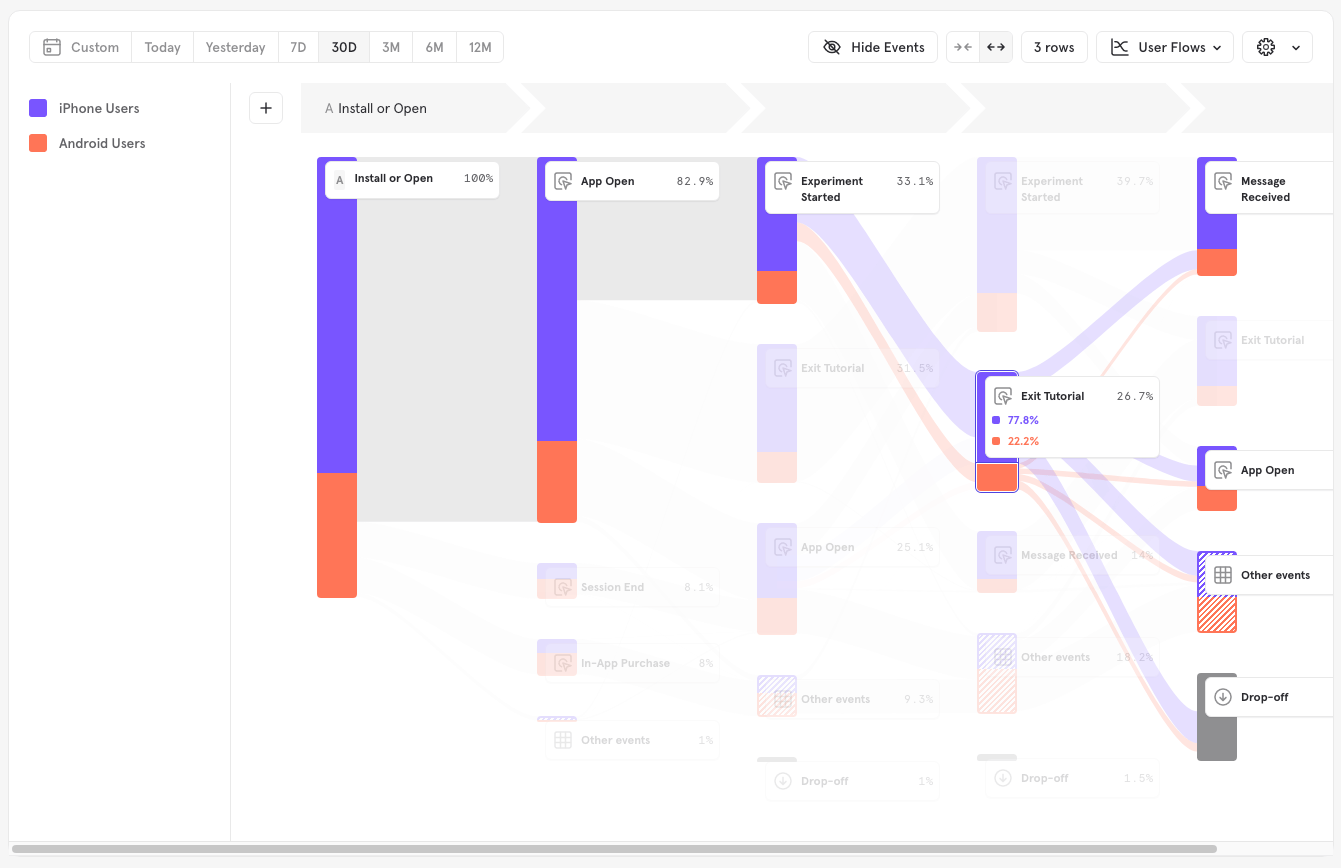
Flows features two visualizations to help you view the results of your query in the clearest chart type. By default, Flows displays the User Flows chart, which uses a Sankey diagram to visually display multiple paths on the same chart. This visualization excels when trying to identify different variants of a similar path, or following one particular trail. User Flows displays a Sankey diagram where the height of the bar is proportional to the number of users who perform that specific event, and the height of the lines that connect bars are proportional to the number of users who perform the the two events in sequence.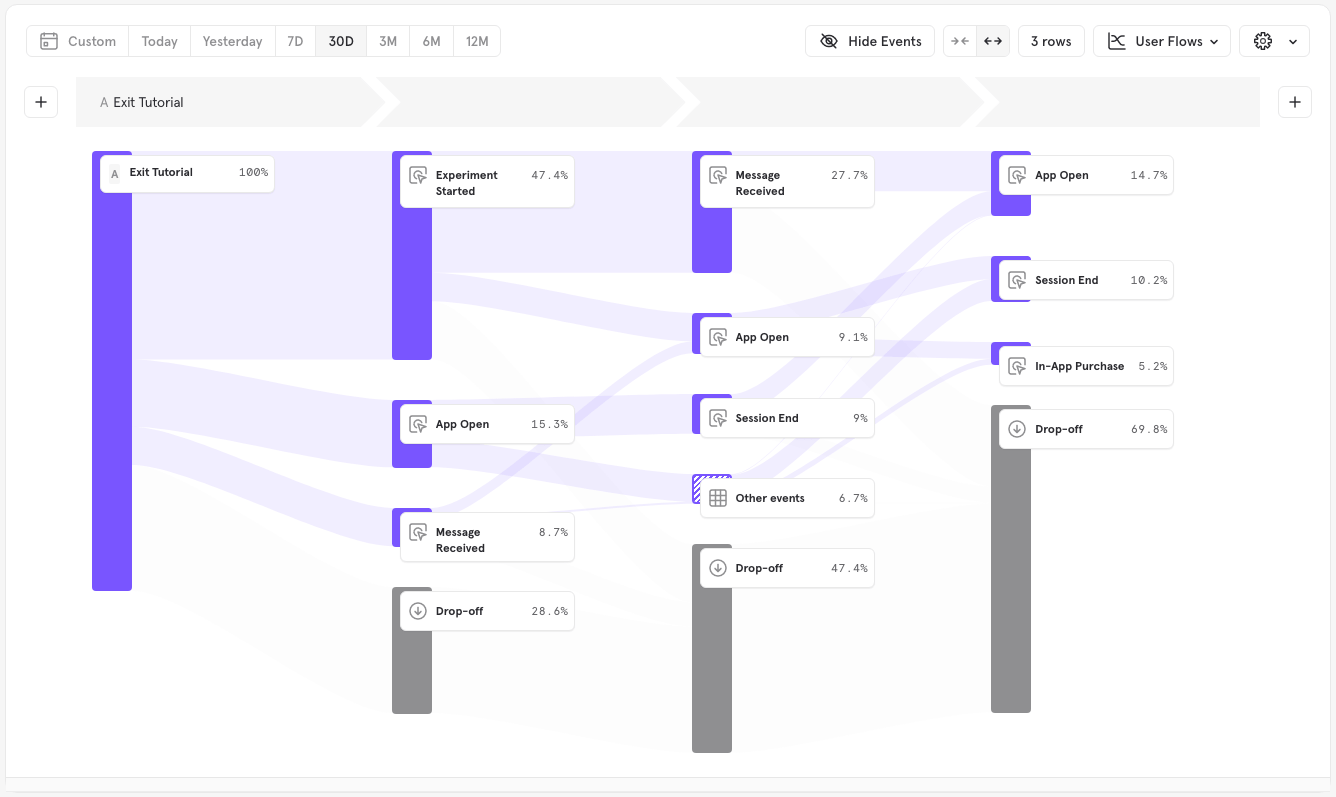
Basic Features
Viewing More Steps
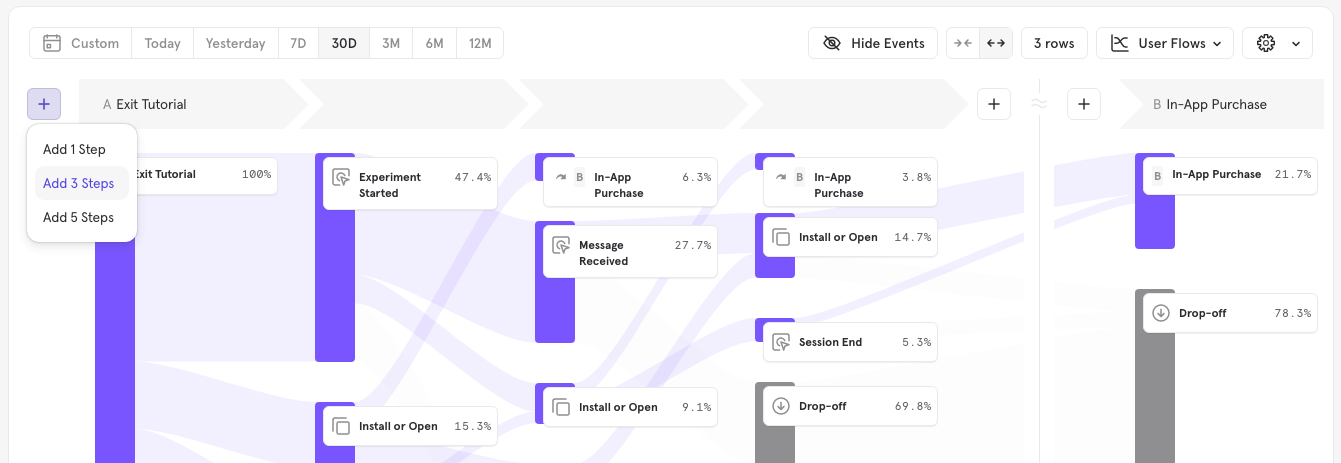
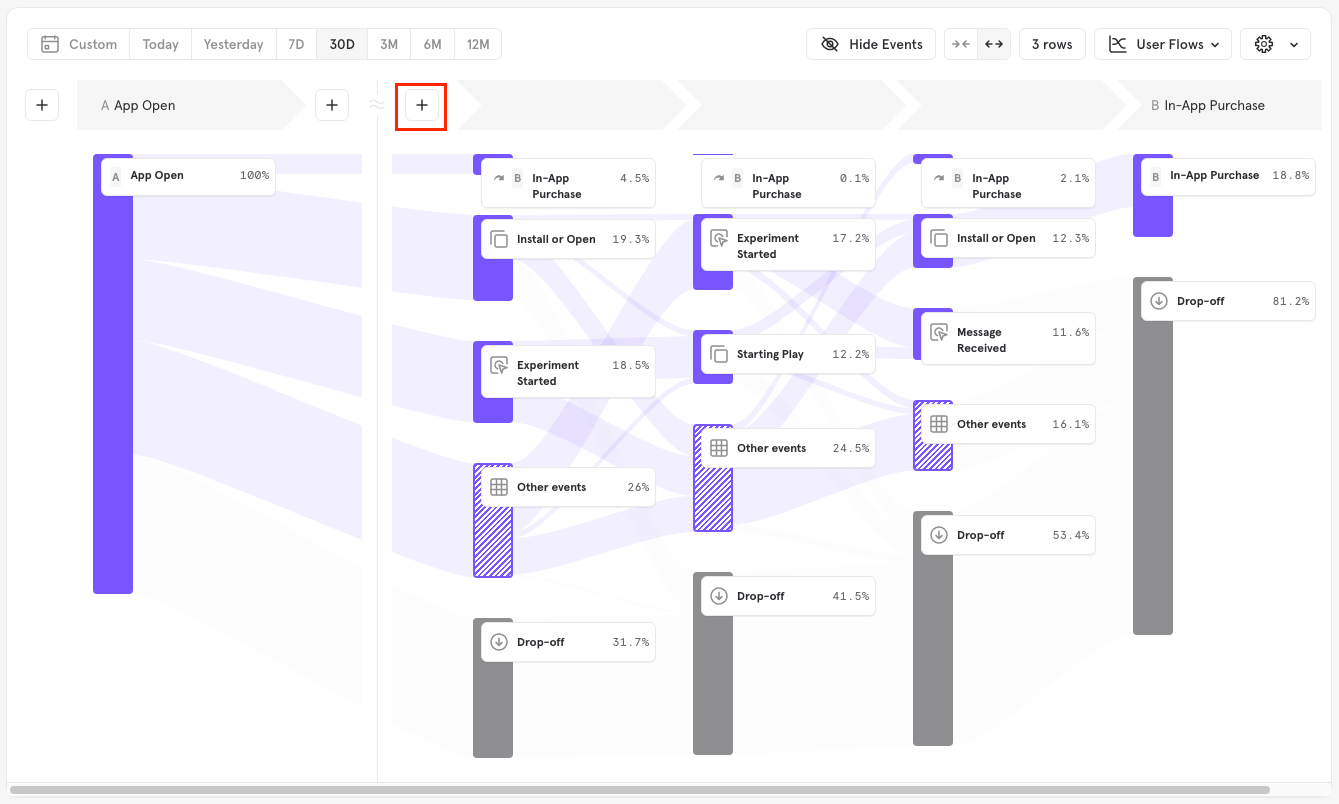
By default, flows shows you the first 3 events performed by users after the selected event. If you wish to see what users did further along in the path, you can adjust the number of steps directly in the Sankey visualization as shown below. Use the ”+” on the right of the visualization to add steps after your selected events of interest to see what paths your users took following these key events.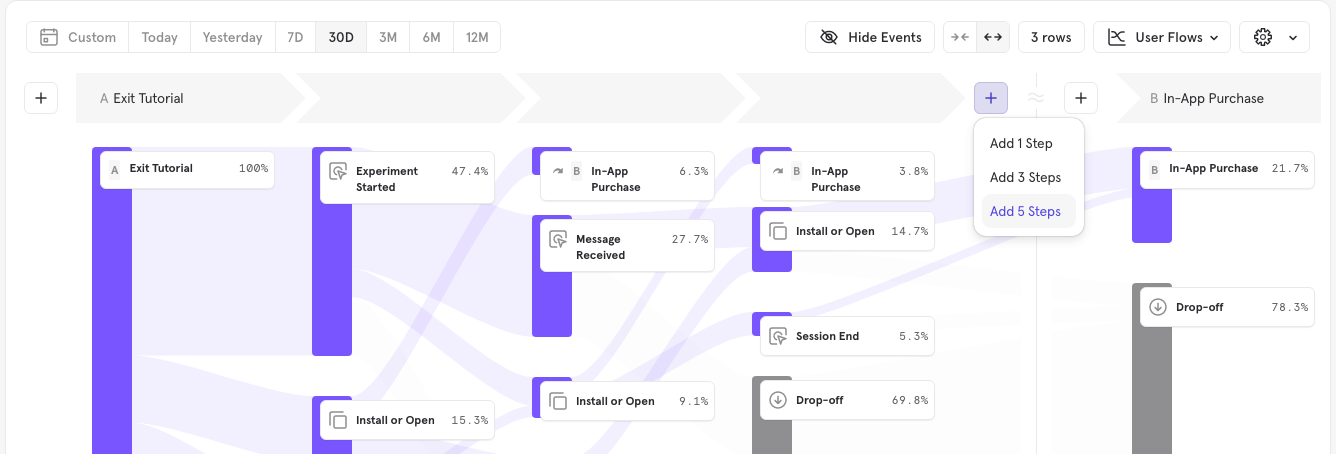
Multiple Anchor Steps
You can add multiple steps in the query builder.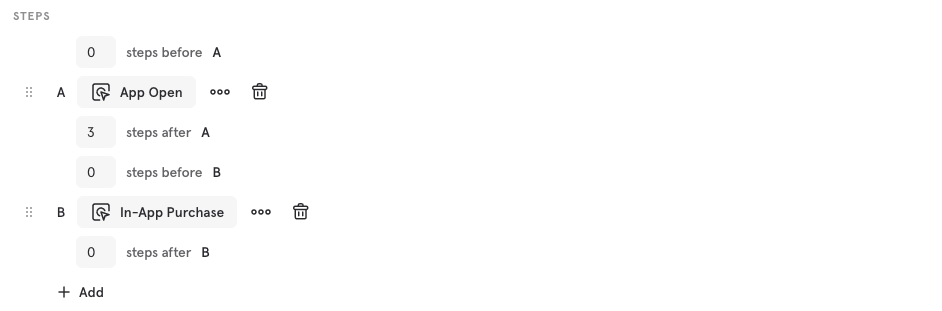
Viewing More Event Flows
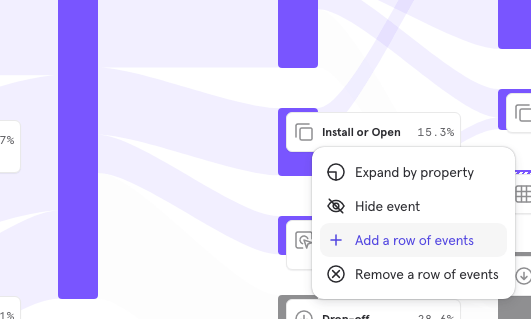
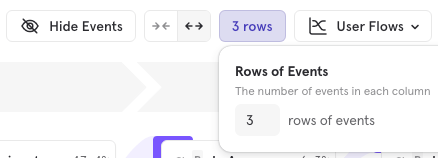
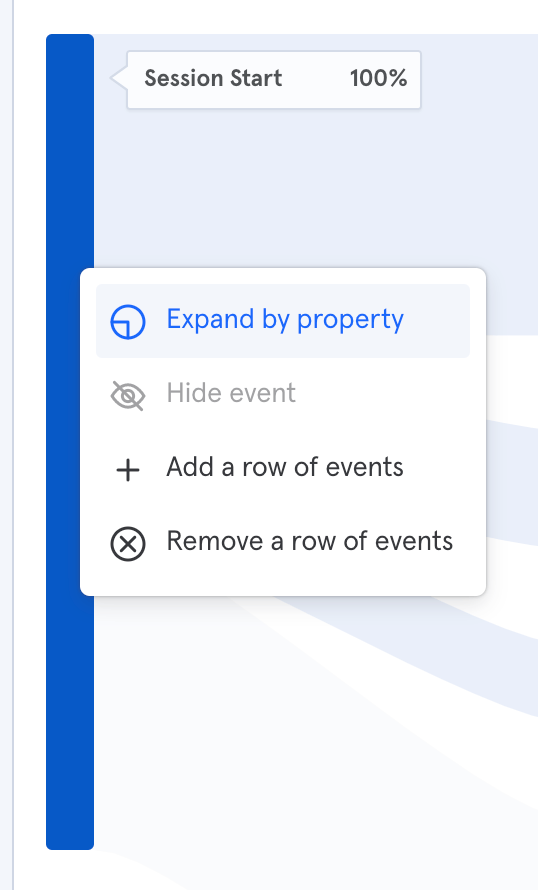
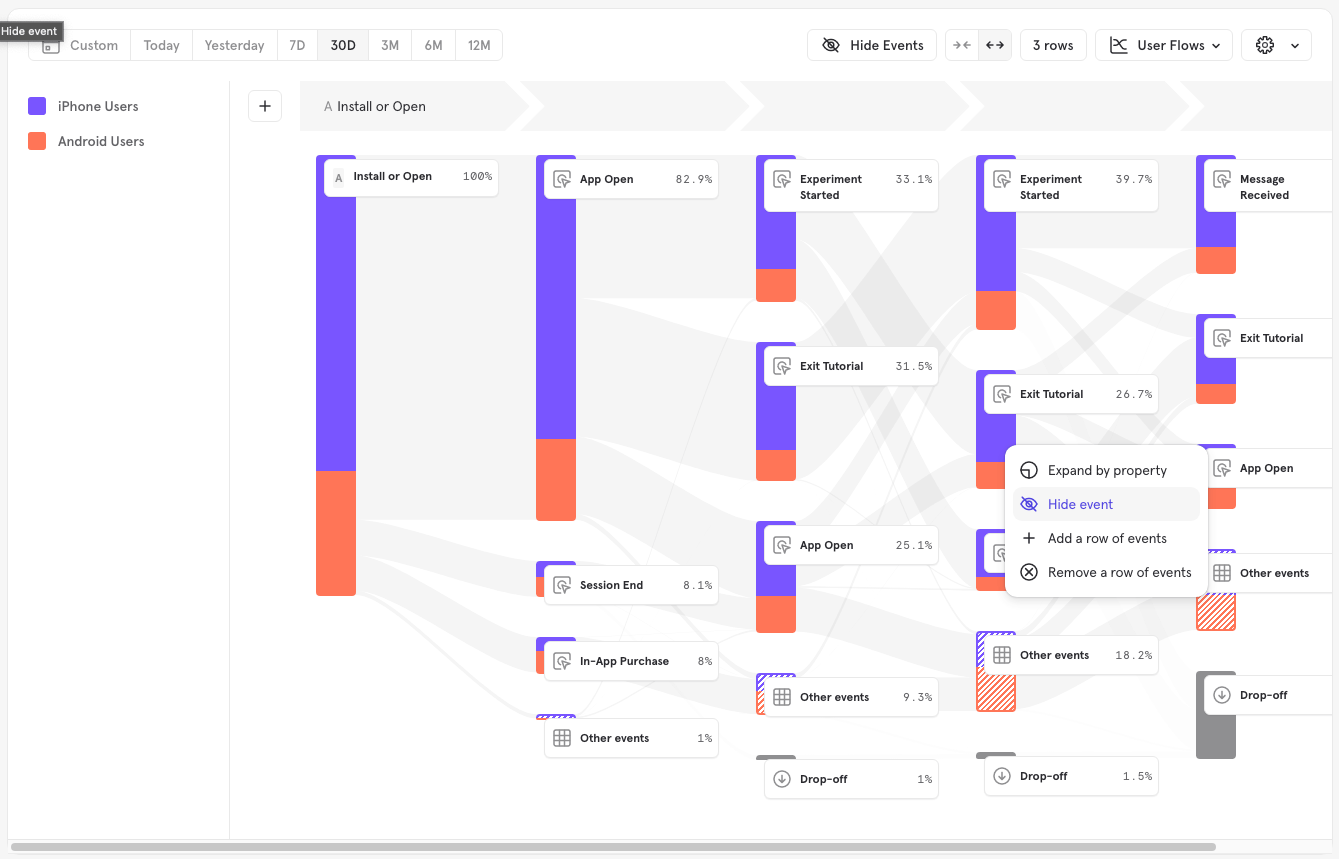
By default, flows only shows you the top 3 events performed by users ordered by the number of users who performed them. Less common events performed by fewer users are combined into an “Other events” section. (Click here. To view more events, simply right click the other events node andAdd a row of events.
Sankey Chart
Selected Events
These are significant moments in a users lifecycle around which you would like to explore user behavior (for example, you may wish to view what users do after a Sign Up event). Selected events are picked in the query builder and are annotated with an alphabetical label (A, B, C) that is shown in the query builder and the sankey diagram.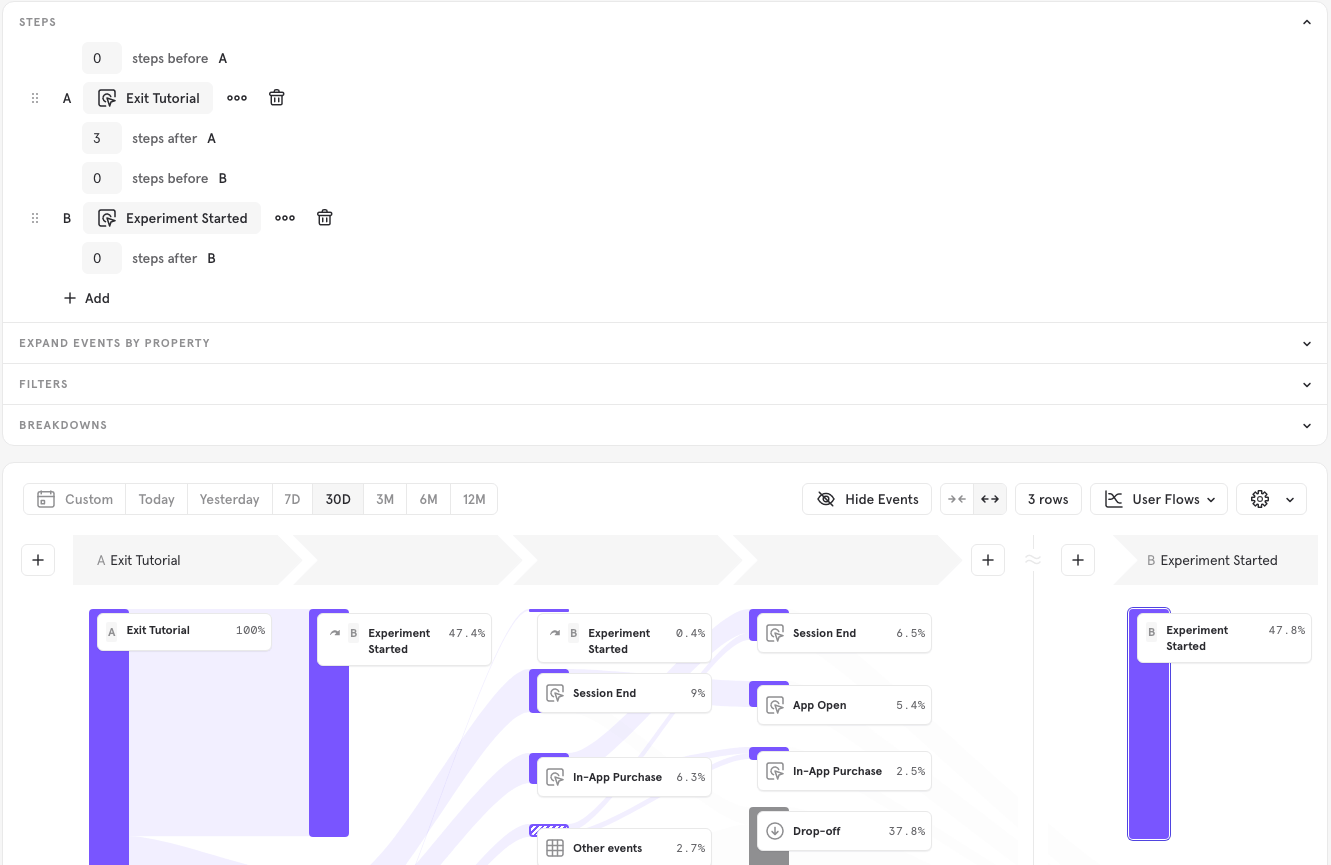
Intermediate Events
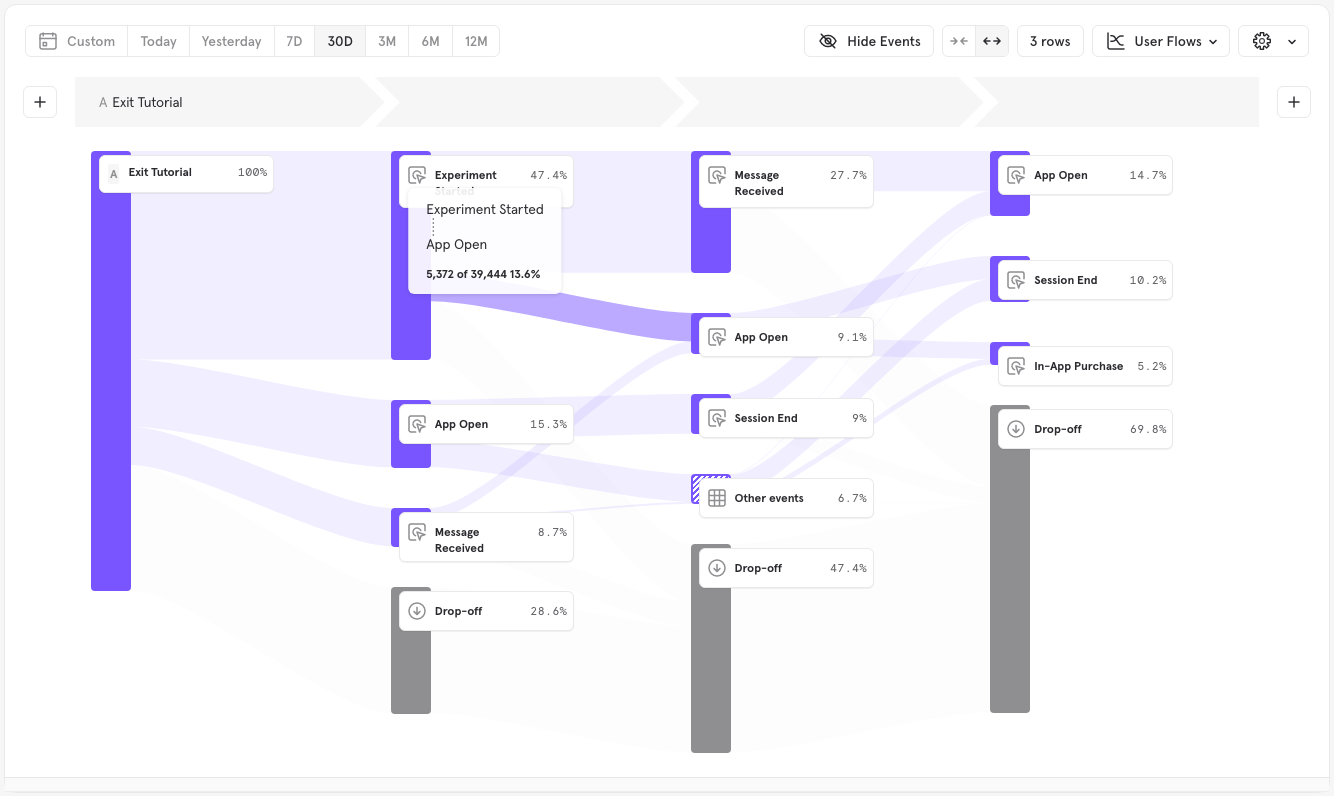
Once an event is selected, Mixpanel calculates the most common events performed by users immediately before or after the selected events. These intermediate events can match either regularly tracked events OR the most used custom events in your project. The icon will let you know at a glance the type of event being displayed.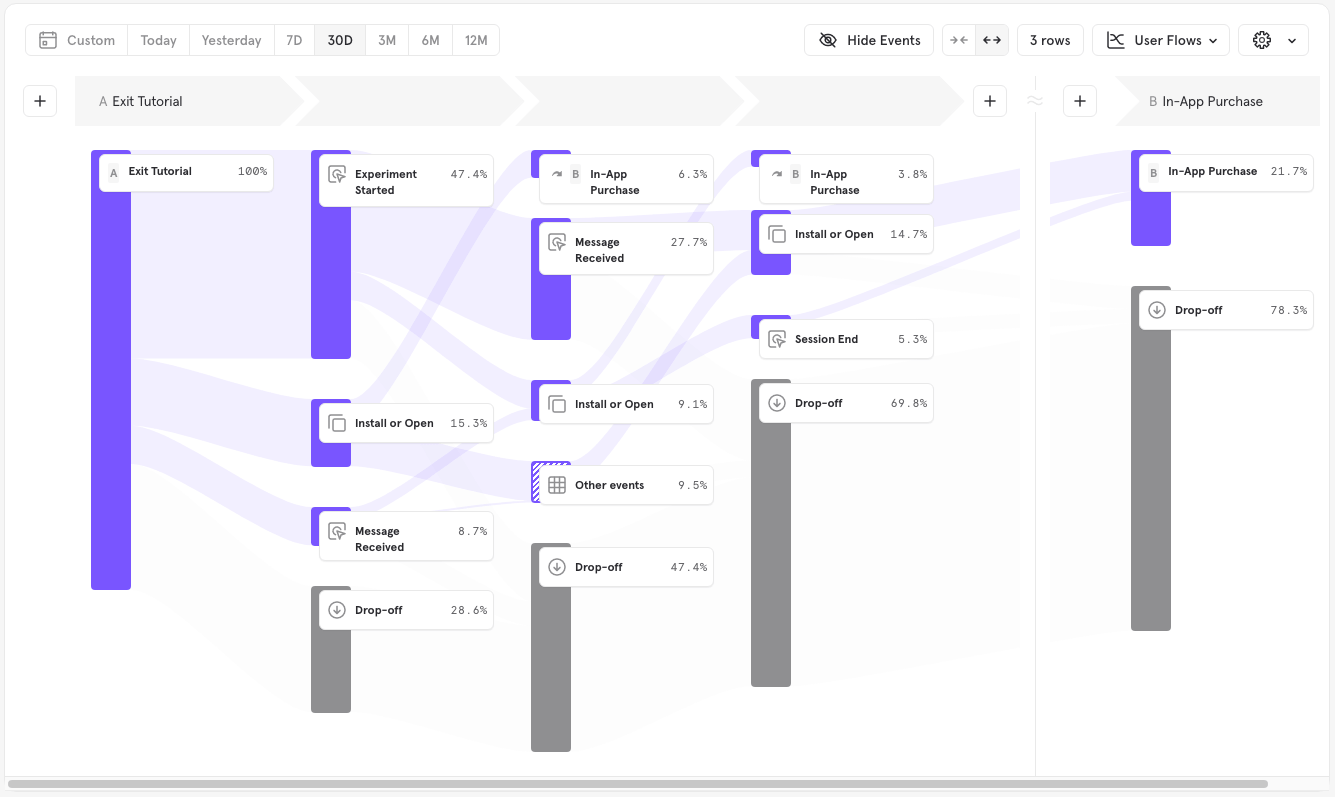
Other Events
At each step in the flow, Mixpanel by default displays the top 3 intermediate events performed by users ordered by the number of users who performed them at that step. The rest of the events performed are grouped into a single bar called “Other events”.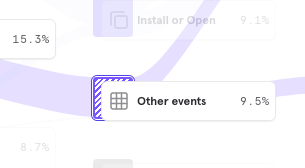
Drop off
“Drop-off” represents users who did not do any further events in the next step during the time period specified in the report, and therefore dropped out of the flow. Users are considered dropped off at future anchor steps selected in the query builder if they do not perform that particular anchor in the time period.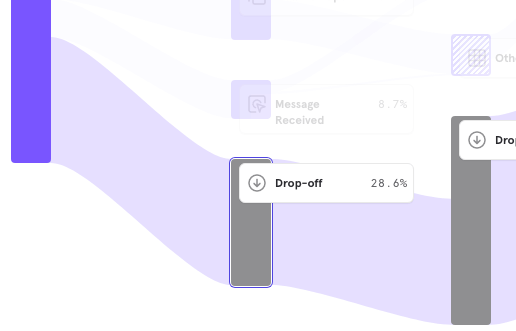
Conversion Criteria
Counting Method
Your selected counting method determines how many times Mixpanel will count a particular user’s activity. Mixpanel Flows can be calculated by uniques, totals, or sessions, the same as the Funnels report. By default, Flows calculations are based on uniques. To change to a different counting method, click on the word Uniques in the conversion criteria, and select between totals or sessions from the drop-down list.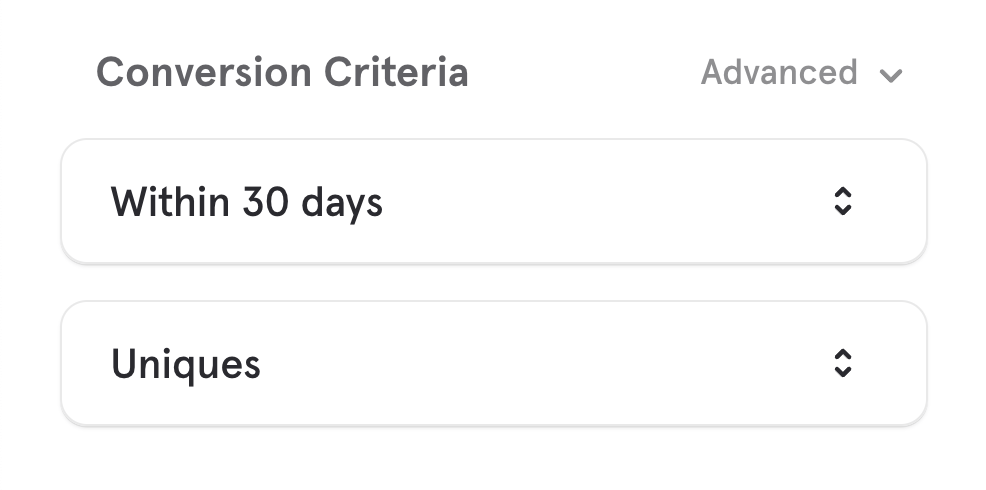
- They complete the last required step in the flow
- They fail to get to the last required step in the conversion window and time out,
- They are excluded from the current flow by an exclusion step.
Conversion Window
The Conversion Window determines how much time a user has to finish the last required step in the flow. By default, all customers have 30 days to complete a flow from the timestamp they perform the Step A event. To adjust this conversion window, click on the words 30 days in the conversion criteria. You will be able to adjust both the unit of time and the amount.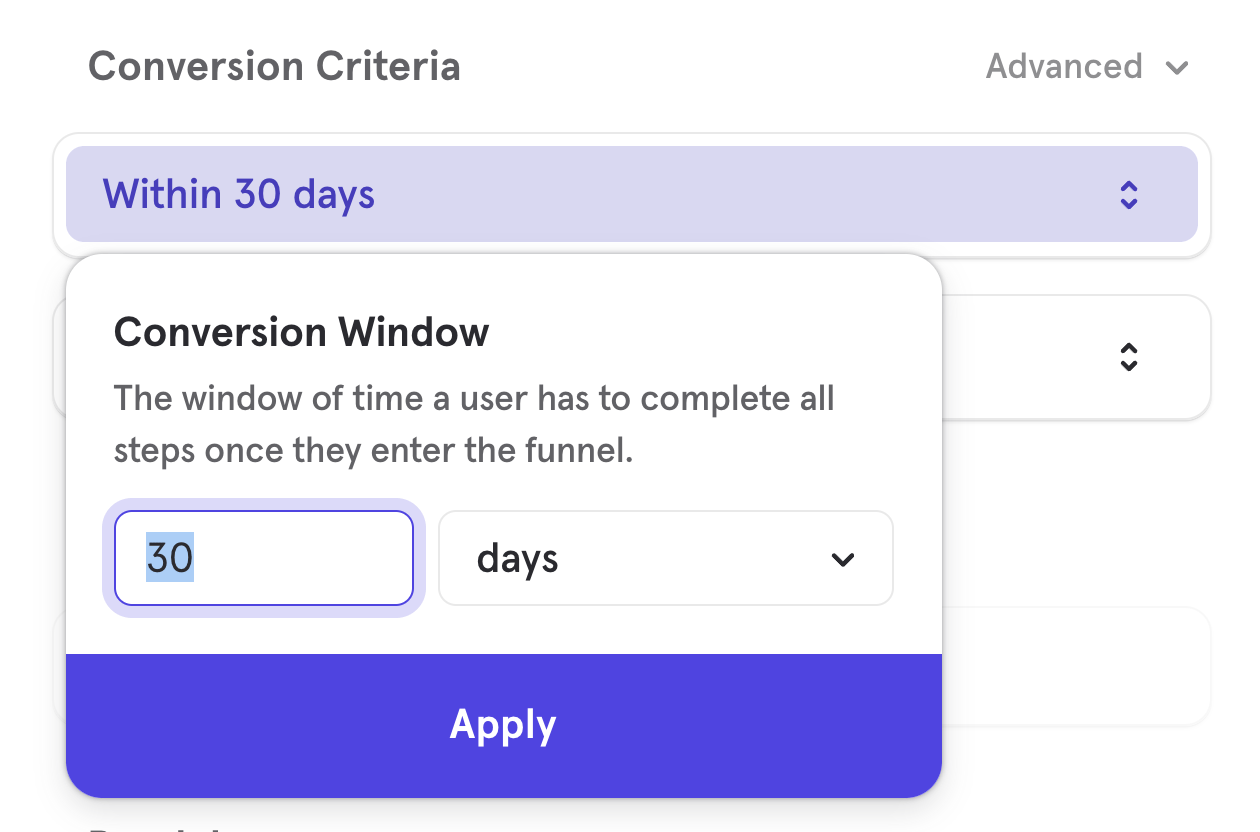
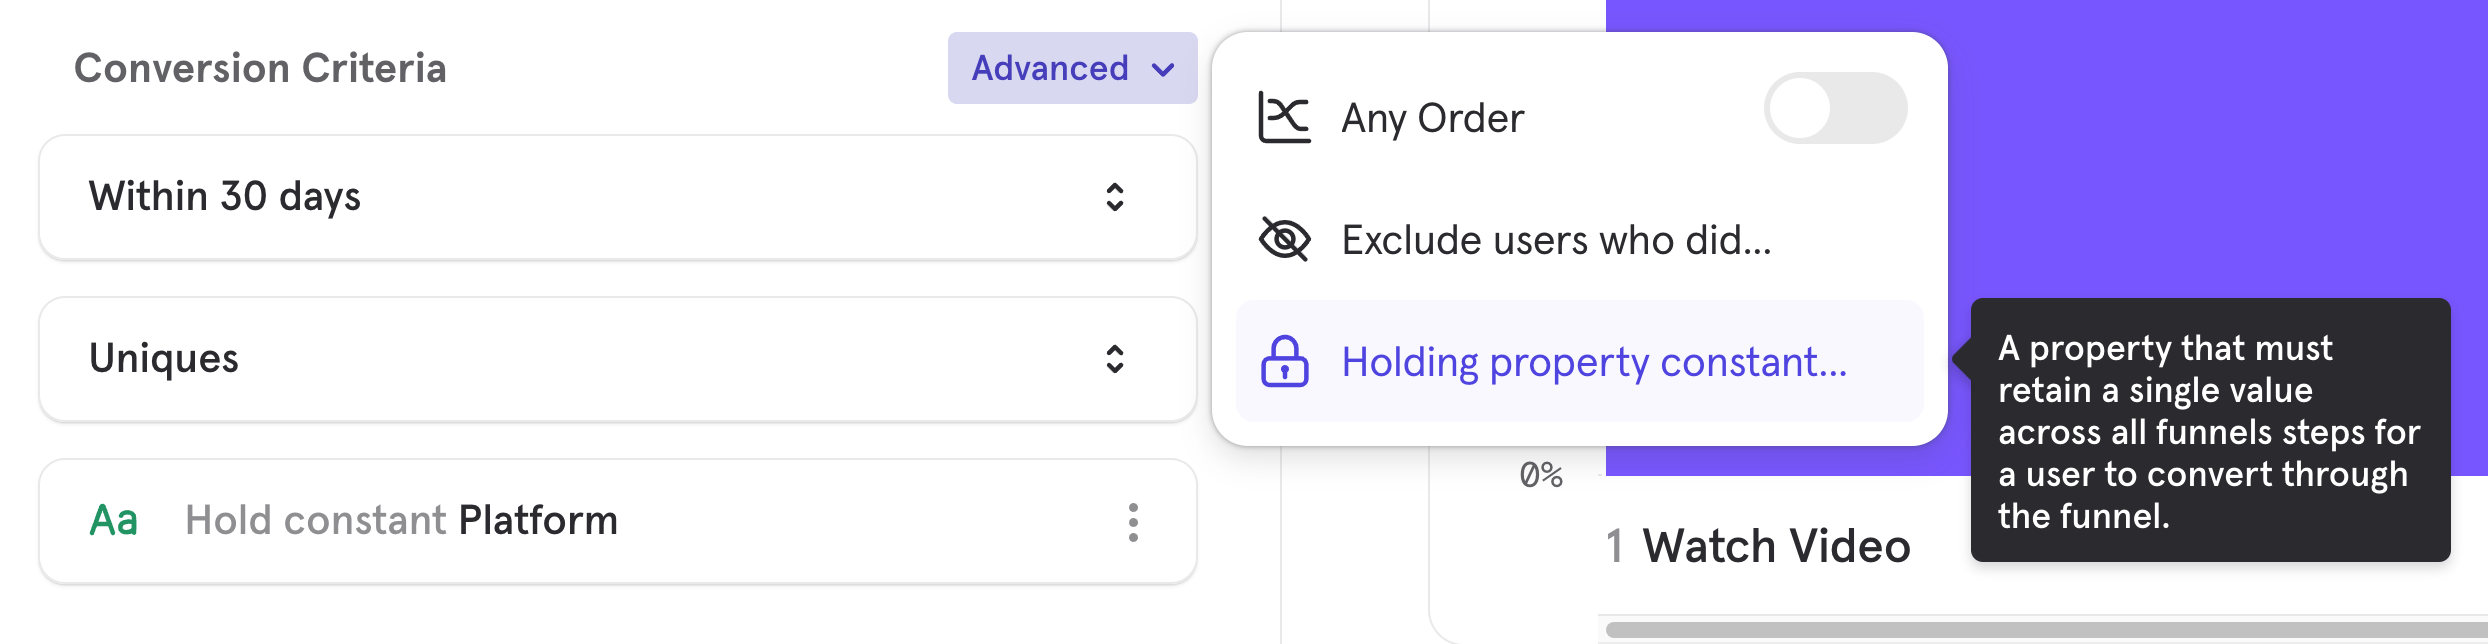
Hold Property Constant
Holding a property constant in flows requires that a user retain the same value of a given event property for an event to be considered part of the flow. For example, let’s say your product is an e-commerce retail site, and you want to see flows between Add to Cart > Purchase as long as they purchased the same item - meaning they must be interacting with the same item in every step of the flow - you would hold the Item Name property constant. The way this is calculated depends on whether you have selected a counting method that does not allow users to re-enter the flow (“Uniques”) or allows re-entry (“Totals” or “Sessions).- Uniques: When you select “Uniques” and hold a property constant, because users of this counting method only enter the flow once and on the first time they do the Step A event, Mixpanel will hold constant the property value from the first Step A event.
- Totals or Sessions: When you select “Totals” or “Sessions” and hold a property constant, since these counting methods allow users to re-enter the flow, Mixpanel will hold the property constant that is set with each new re-entry at the Step A event.
Advanced
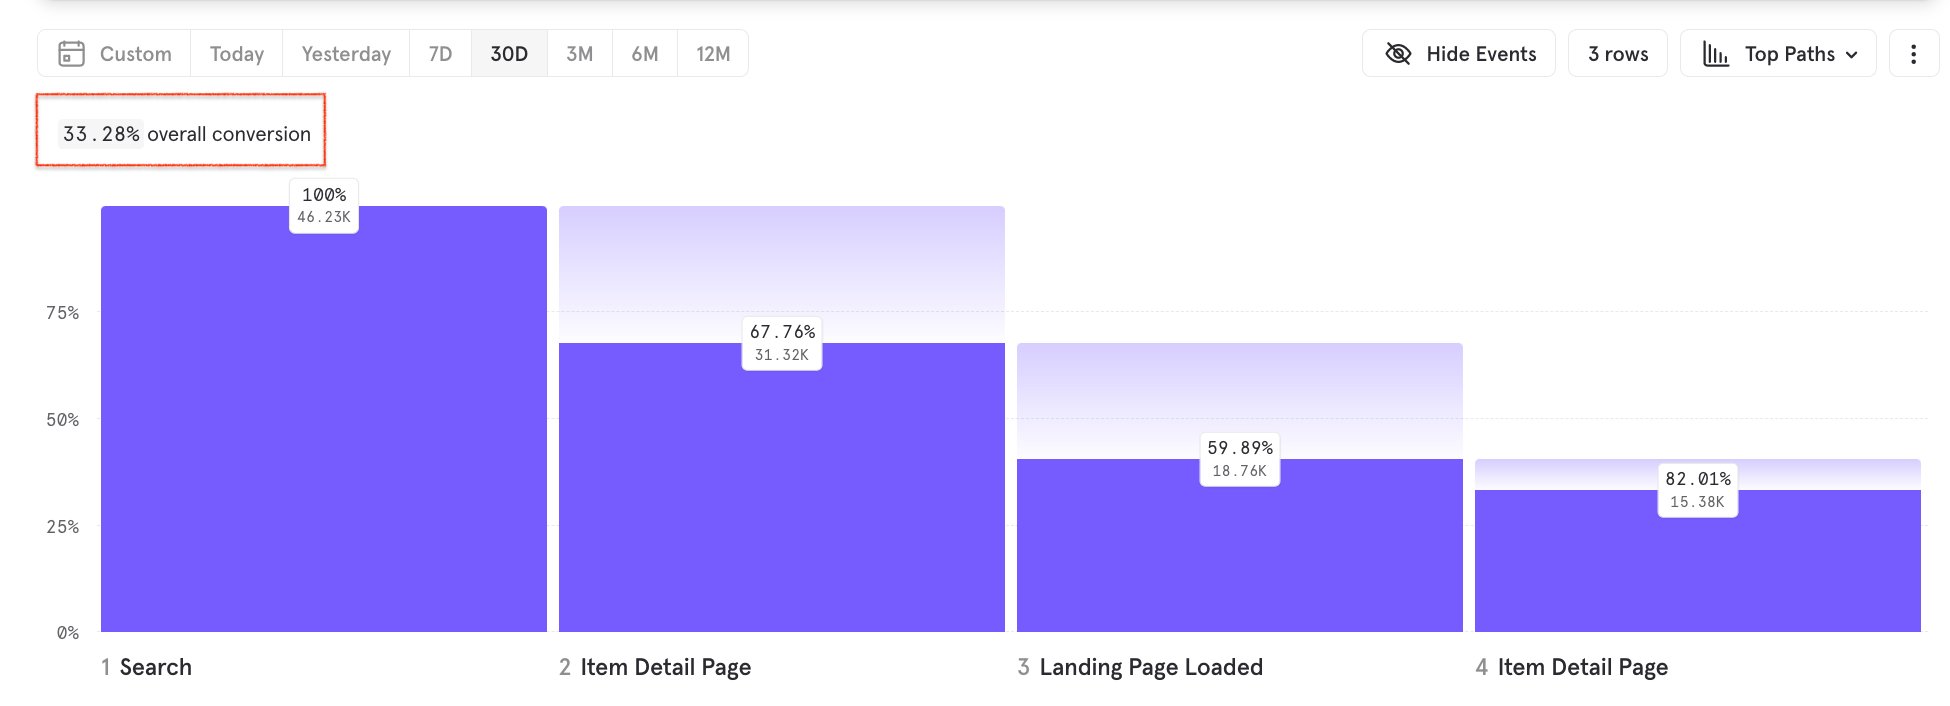
Top Paths
Another way to visualize your user flows is by “Top Paths”, which condenses the flows down to unique paths on each row. This visualization is great for understanding the most common paths users take, though they may not be similar. In this case, since we want to understand the most common paths, choose Top Paths. Your report should look like this: In the top bar of the visualization, you will see the option to toggle between User Flows and Top Paths.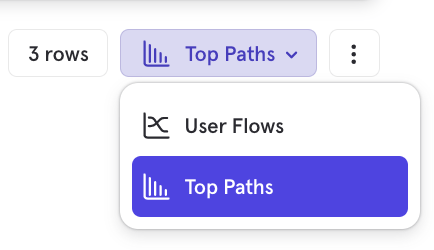
Expand Event by Property
You can choose to expand the results of your report by a particular property to see how that property may impact user flows. You can select multiple properties. For instance, what if I wanted to understand how the specific Purchase Type changes the most common flow that leads to a Purchase event? Click the Expand button, select an event, and then select a property under that event.
Breakdown and Compare by Cohorts
Beside the Filter button, select the Breakdown button to select one or more cohorts from the drop-down list. You will be shown both users in and not in the cohort.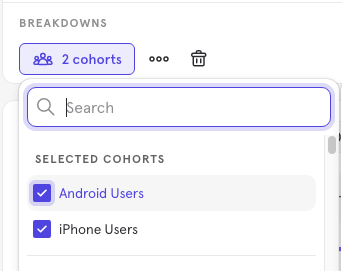
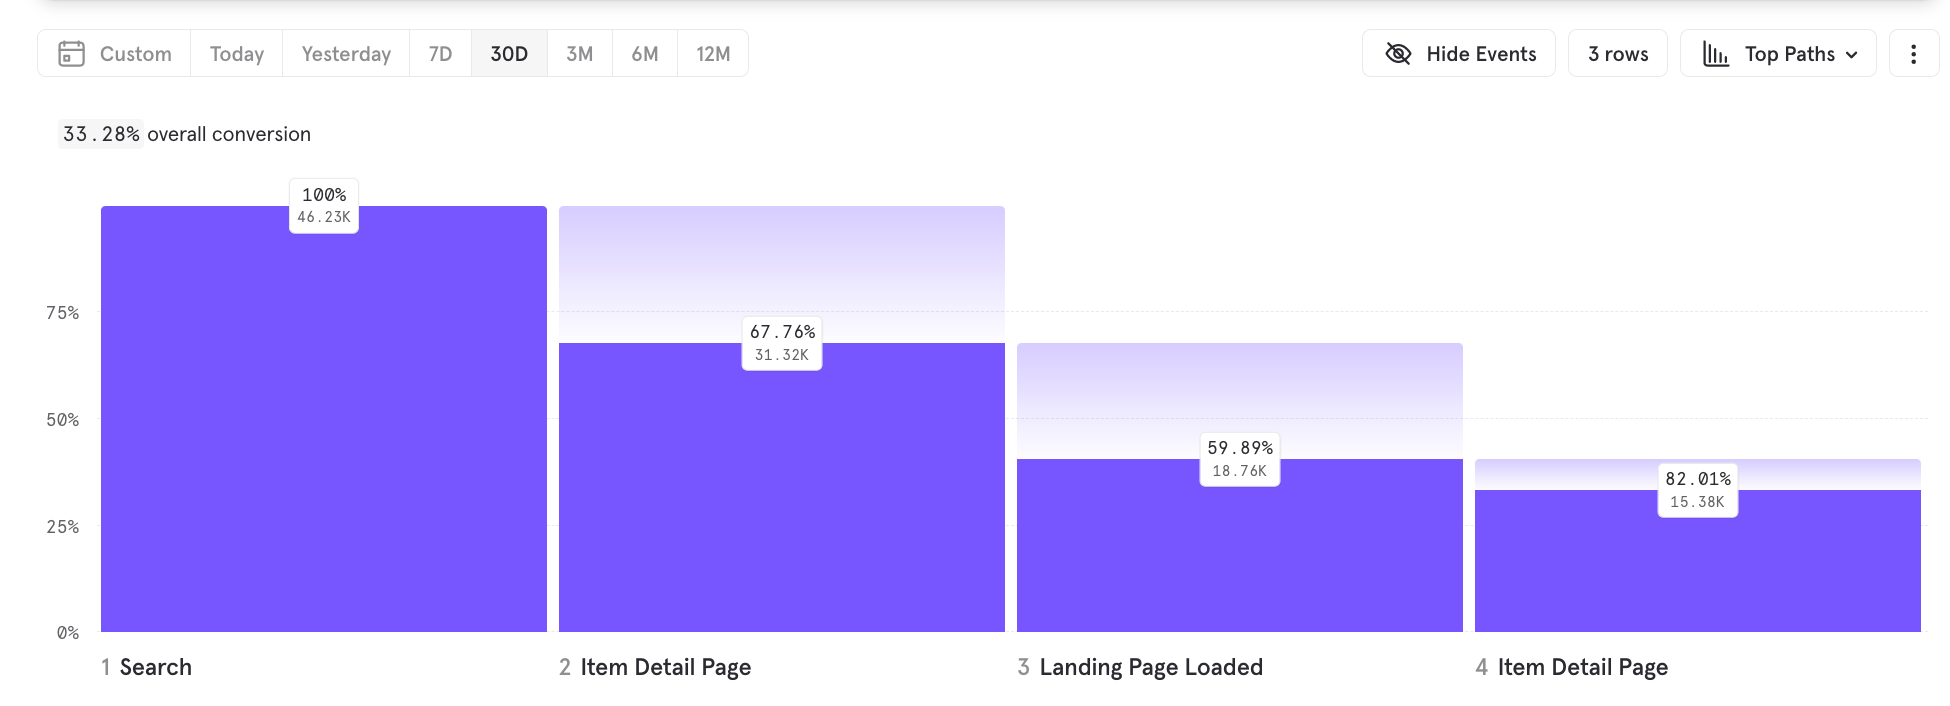
Hide Events
You can choose to hide events from the flows report to simplify and clarify the results. This is useful if you have common events that add noise because they are not relevant to the workflow you are examining. Click the Hide Events button at the top of the chart and check any events you want to hide from the query, then click Apply.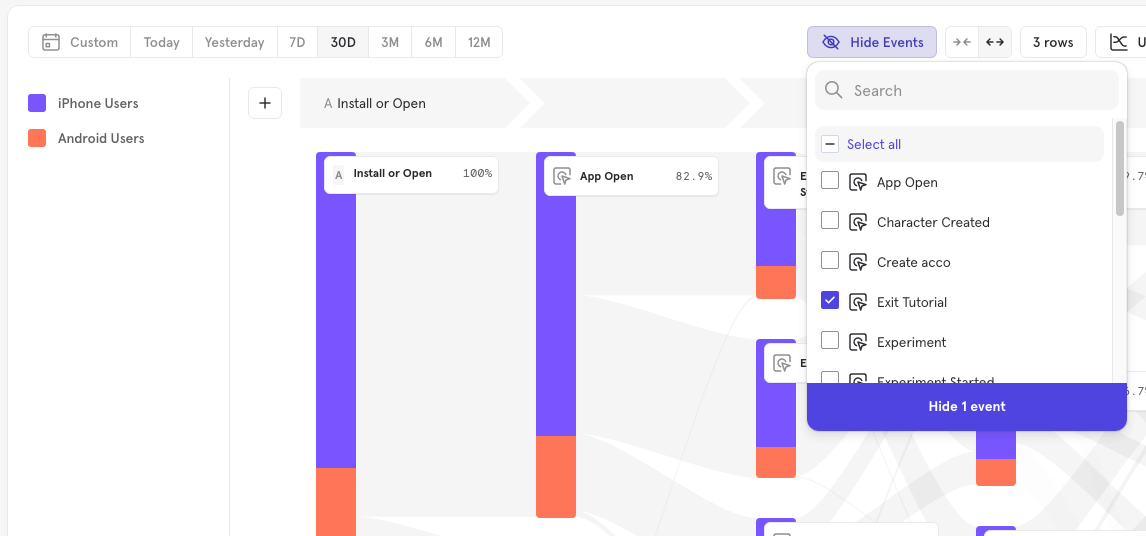
Custom Events in Flows
Custom events as start/end events
You may pick custom events as the starting or ending events directly in the query. For custom events that are composed of multiple events, paths consisting of either event are combined into a single flow.Custom events as intermediate events
Mixpanel automatically considers the most used and common custom events in your project, displaying them in intermediate steps instead of showing the underlying events. When a custom event is shown instead of the underlying event, it is annotated with the custom event icon to indicate that the event displayed is a custom event.
- Custom events that are shared with all users in the projects are the only ones picked to be shown in flows right now
- Only the 50 most frequently queried custom events in the project are used in flows analysis.
- If custom events have overlapping definitions (e.g. both custom events operate on the same event), we will choose the more frequently queried custom event to show in the report.
Expanding custom events
You may also expand custom events by event name to view the underlying events if required.
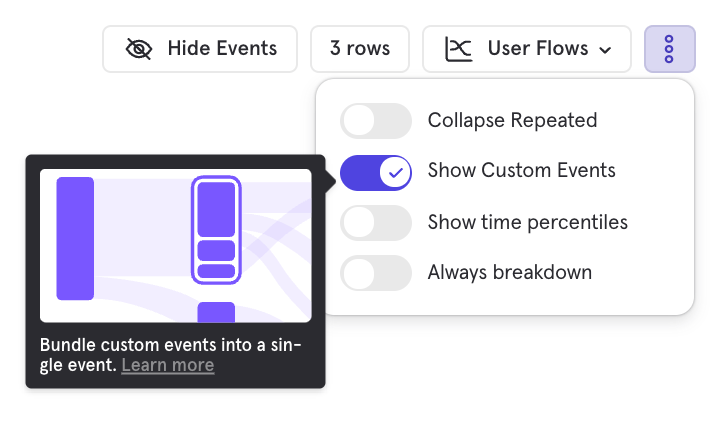
Disabling custom events
You can disable custom events for flows by toggling the Show Custom Events in the dropdown menu below. Custom events that have been manually chosen as steps in the flow will continue to show up, but no other other custom events will be shown.