> ## Documentation Index
> Fetch the complete documentation index at: https://docs.mixpanel.com/llms.txt
> Use this file to discover all available pages before exploring further.
# Alerts: Get notified about anomalies in your data
Users with a paid plan can access Alerts. Growth plan users can set up to 5 alerts per project. Enterprise plan users can set an unlimited number of alerts. See our [pricing page](https://mixpanel.com/pricing/) for more details.
{/* SECTION 1: OVERVIEW — [UPDATED] */}
{/* ============================================================ */}
## Overview
Mixpanel provides the ability to create alerts for your Insights and Funnels reports, allowing you to monitor custom report conditions or automatically detect anomalies and receive notifications when those conditions are met.
Alerts are accessible directly from the **bell icon** in any report header, and can be delivered via email, Slack, or webhook. You can also control *when* alerts fire by setting notification windows restricted to specific days and times, so you only get notified when it matters.
When an alert is active, Mixpanel continuously monitors its validity — surfacing warnings if report changes could affect it — and sends a one-time email if an alert ever becomes invalid. Additionally, Mixpanel's Root Cause Analysis feature helps you investigate and understand the underlying data behind any triggered alert.
{/* SECTION 2: CREATE AN ALERT — [UPDATED] */}
{/* windows and Test Alert added inline. Note re: unsaved changes kept. */}
## Create an Alert
To create and manage alerts, you will need an analyst, admin, or owner project role. Learn more about [Roles and Permissions](/docs/orgs-and-projects/roles-and-permissions).
Create an alert for your Insights and Funnels reports and be notified when report conditions reach certain thresholds. Alerts can be delivered via email, Slack, or webhook, and can be sent to multiple recipients.
**To create an alert, follow these steps:**
1. Open a saved report and click the **bell icon** in the report header.
*Note: You won't be able to create an alert if the report has unsaved changes. Save your report before setting up an alert.*
If no alerts exist on the report, the modal will show *"No alerts for this report."* Click **Create Alert** in the bottom right of the modal.
2. **Enter a name** for your alert.
3. If your report has more than one event, select an event to track. If your report has a breakdown applied, either select a specific segment to alert on, or select **Any segment** to be alerted when any segment matches the alert criteria.
4. **Set your alert criteria.** Depending on the report type, choose between Anomaly Detection or Custom Threshold. See [Alert Criteria Types](#alert-criteria-types) below for details on each.
5. **Set your notification frequency.** Choose how often *at most* you'll receive an alert — from hourly up to monthly.
*Note:*
* *For time-series reports, how often Mixpanel checks your data is determined by the time bucket of your report visualization. For example, if your chart is hourly, the alert will be evaluated at an hourly interval.*
* *If you have an hourly chart but set the alert frequency to daily, Mixpanel checks for a match every hour. If a match is found, the alert fires and won't check again until the next day.*
6. **Set your notification timing.** Choose when the alert is allowed to fire:
* **Any time** — the alert fires whenever the condition is met, regardless of day or time.
* **During Selected Windows** — restrict the alert to specific days and/or time ranges. See [Notification Windows](#notification-windows) below.
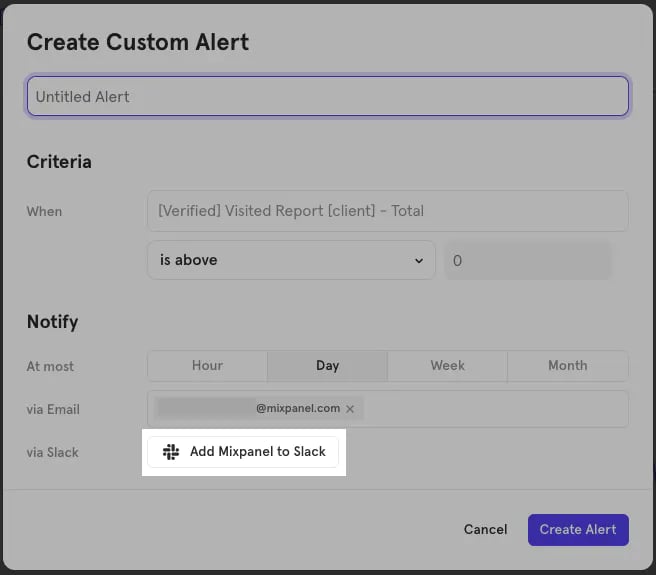
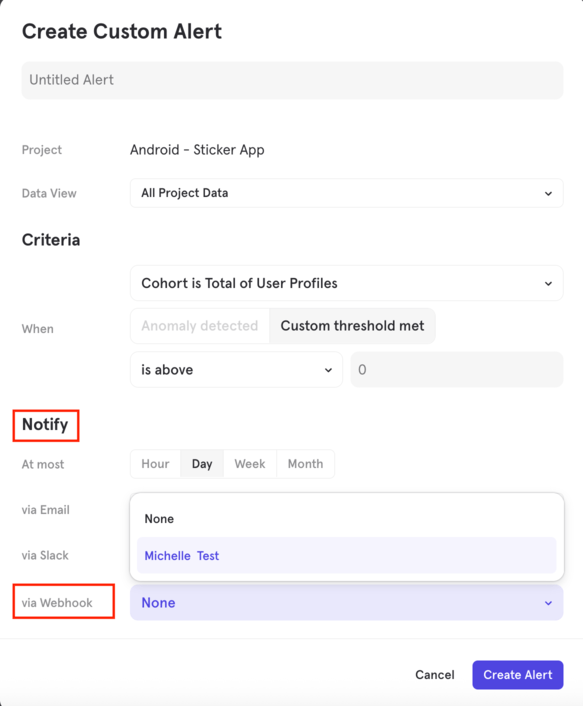
7. **Set your notification delivery preferences.** When alert conditions are met, Mixpanel can notify you via email, Slack, or webhook.
* **Email** — enter the recipient's email address. You can enter any email, not just Mixpanel users.
* **Slack** — select the Slack channels to notify. Private Slack channels are not supported. You may need to configure the Mixpanel Slack app first — click **Add Mixpanel to Slack** and follow the prompts.
* **Webhook** — select a configured webhook from the dropdown. See [Webhook Alerts](#webhook-alerts) for setup instructions.
 8. Optionally, click **Test Alert** to send a test notification before saving. See [Test Alert](#test-alert) below.
9. **Save** the alert.
{/* SECTION 3: NOTIFICATION WINDOWS — [NEW] */}
{/* ============================================================ */}
## Notification Windows
When you select **During Selected Windows** in step 6 of alert creation, a day-by-day schedule appears. Each row represents a day and supports an optional time range, letting you restrict when the alert is allowed to fire.
**Adding windows:**
* **Add Single Day Window** — adds a row for a specific day with an optional time range.
* **Weekdays** — quick-adds rows for Monday through Friday.
* **Weekends** — quick-adds rows for Saturday and Sunday.
**Managing individual rows:**
Each day row has a `...` overflow menu with:
* **Duplicate Day Window** — copies the row's time window to a new row.
* **Remove Time Window** — clears the time range from that row but keeps the day active (alert can fire any time on that day).
* **Delete Day Window** — removes the entire day row from the schedule.
*Note: Notification windows restrict when the alert fires, not when Mixpanel checks your data. Mixpanel will still evaluate the alert condition according to its frequency — it just won't send a notification outside your defined windows.*
{/* SECTION 4: TEST ALERT — [NEW] */}
{/* ============================================================ */}
## Test Alert
The **Test Alert** button is available in both the Create and Edit alert flows. Clicking it sends a test notification to all configured recipients (email, Slack, and/or webhook) immediately — without saving the alert.
Test notifications are identical in format to live alert notifications, but the alert name is prefixed with **\[TEST]** so recipients know it isn't a real firing.
Use Test Alert to confirm your delivery settings are correct before saving.
{/* SECTION 5: ALERT STATUS & VALIDITY — [NEW] */}
{/* ============================================================ */}
## Alert Status & Validity
Mixpanel actively tracks whether each alert is in a valid state and surfaces this information directly in the report.
### Bell icon status
When a report has one or more alerts, the **bell icon** in the report header shows each alert's name and current status:
* **✅ Valid** — the alert is active and monitoring as expected.
* **Invalid** — the alert's configuration no longer matches the current report (for example, the event or breakdown it was tracking has changed). Invalid alerts will not fire until corrected.
Click any alert name in the bell icon modal to open it and edit.
### Warning banner for unsaved changes
If you've made unsaved changes to a report that has active alerts, an **orange warning banner** appears in the bell icon modal. This is a preemptive notice — it means your current unsaved changes *could* affect the alert if saved. The alert's status will still show ✅ Valid until you actually save the report.
### Save Report Changes modal
When you save a report that has active alerts, a **Save Report Changes** modal appears listing the affected alerts (name, creator, creation date). This gives you a chance to review the impact before confirming. You can choose to:
* **Save changes** — saves the report and potentially invalidates the listed alerts.
* **Save as new report** — creates a new copy of the report with your changes, leaving the original report and its alerts untouched.
> **Tip:** If you want to update a report without breaking existing alerts, use **Save as new report** and recreate the alert on the new version.
### Invalid alert notification email
When an alert first becomes invalid, Mixpanel sends a **one-time email** to the alert's creator notifying them. This email is sent only once — if the alert remains invalid, no further emails are sent. Open the alert from the bell icon modal to see the reason for invalidation and how to fix it.
{/* SECTION 6: WEBHOOK ALERTS — [UNCHANGED] */}
{/* be managed from Project Settings > Alerts (see View & Manage section). */}
## Webhook Alerts
Webhook Alerts allow you to send alert notifications from Mixpanel to third-party platforms via HTTP webhooks. When a configured alert is triggered, Mixpanel will automatically send a payload containing alert details to your specified endpoint.
**Creating a Webhook:**
1. Navigate to **Gear Icon** > **Integrations** > **Notification Webhook**. Note this is separate from [Custom Webhooks](/docs/cohort-sync/webhooks) (which are used to sync cohorts).
2. Under Project Webhooks, click **"+ Add Webhook"**.
3. Complete the webhook configuration:
* **Name** — enter a descriptive name (e.g., "Production Alerts").
* **URL** — enter the HTTPS endpoint where alert payloads will be sent.
* **Username** — if your endpoint requires HTTP Basic Authentication, enter the username.
* **Password** — enter the corresponding password for authentication.
4. Click **Test connection** to verify connectivity.
5. Click **Submit** to save the webhook.
You can also manage webhooks directly from **Project Settings > Alerts** via the **Manage Webhooks** button in the table toolbar.
**Configuring Webhook Delivery for an Alert:**
1. When creating or editing an alert, scroll to the **Notify** section.
2. Locate the **via Webhook** dropdown.
3. Select your webhook from the available options.
8. Optionally, click **Test Alert** to send a test notification before saving. See [Test Alert](#test-alert) below.
9. **Save** the alert.
{/* SECTION 3: NOTIFICATION WINDOWS — [NEW] */}
{/* ============================================================ */}
## Notification Windows
When you select **During Selected Windows** in step 6 of alert creation, a day-by-day schedule appears. Each row represents a day and supports an optional time range, letting you restrict when the alert is allowed to fire.
**Adding windows:**
* **Add Single Day Window** — adds a row for a specific day with an optional time range.
* **Weekdays** — quick-adds rows for Monday through Friday.
* **Weekends** — quick-adds rows for Saturday and Sunday.
**Managing individual rows:**
Each day row has a `...` overflow menu with:
* **Duplicate Day Window** — copies the row's time window to a new row.
* **Remove Time Window** — clears the time range from that row but keeps the day active (alert can fire any time on that day).
* **Delete Day Window** — removes the entire day row from the schedule.
*Note: Notification windows restrict when the alert fires, not when Mixpanel checks your data. Mixpanel will still evaluate the alert condition according to its frequency — it just won't send a notification outside your defined windows.*
{/* SECTION 4: TEST ALERT — [NEW] */}
{/* ============================================================ */}
## Test Alert
The **Test Alert** button is available in both the Create and Edit alert flows. Clicking it sends a test notification to all configured recipients (email, Slack, and/or webhook) immediately — without saving the alert.
Test notifications are identical in format to live alert notifications, but the alert name is prefixed with **\[TEST]** so recipients know it isn't a real firing.
Use Test Alert to confirm your delivery settings are correct before saving.
{/* SECTION 5: ALERT STATUS & VALIDITY — [NEW] */}
{/* ============================================================ */}
## Alert Status & Validity
Mixpanel actively tracks whether each alert is in a valid state and surfaces this information directly in the report.
### Bell icon status
When a report has one or more alerts, the **bell icon** in the report header shows each alert's name and current status:
* **✅ Valid** — the alert is active and monitoring as expected.
* **Invalid** — the alert's configuration no longer matches the current report (for example, the event or breakdown it was tracking has changed). Invalid alerts will not fire until corrected.
Click any alert name in the bell icon modal to open it and edit.
### Warning banner for unsaved changes
If you've made unsaved changes to a report that has active alerts, an **orange warning banner** appears in the bell icon modal. This is a preemptive notice — it means your current unsaved changes *could* affect the alert if saved. The alert's status will still show ✅ Valid until you actually save the report.
### Save Report Changes modal
When you save a report that has active alerts, a **Save Report Changes** modal appears listing the affected alerts (name, creator, creation date). This gives you a chance to review the impact before confirming. You can choose to:
* **Save changes** — saves the report and potentially invalidates the listed alerts.
* **Save as new report** — creates a new copy of the report with your changes, leaving the original report and its alerts untouched.
> **Tip:** If you want to update a report without breaking existing alerts, use **Save as new report** and recreate the alert on the new version.
### Invalid alert notification email
When an alert first becomes invalid, Mixpanel sends a **one-time email** to the alert's creator notifying them. This email is sent only once — if the alert remains invalid, no further emails are sent. Open the alert from the bell icon modal to see the reason for invalidation and how to fix it.
{/* SECTION 6: WEBHOOK ALERTS — [UNCHANGED] */}
{/* be managed from Project Settings > Alerts (see View & Manage section). */}
## Webhook Alerts
Webhook Alerts allow you to send alert notifications from Mixpanel to third-party platforms via HTTP webhooks. When a configured alert is triggered, Mixpanel will automatically send a payload containing alert details to your specified endpoint.
**Creating a Webhook:**
1. Navigate to **Gear Icon** > **Integrations** > **Notification Webhook**. Note this is separate from [Custom Webhooks](/docs/cohort-sync/webhooks) (which are used to sync cohorts).
2. Under Project Webhooks, click **"+ Add Webhook"**.
3. Complete the webhook configuration:
* **Name** — enter a descriptive name (e.g., "Production Alerts").
* **URL** — enter the HTTPS endpoint where alert payloads will be sent.
* **Username** — if your endpoint requires HTTP Basic Authentication, enter the username.
* **Password** — enter the corresponding password for authentication.
4. Click **Test connection** to verify connectivity.
5. Click **Submit** to save the webhook.
You can also manage webhooks directly from **Project Settings > Alerts** via the **Manage Webhooks** button in the table toolbar.
**Configuring Webhook Delivery for an Alert:**
1. When creating or editing an alert, scroll to the **Notify** section.
2. Locate the **via Webhook** dropdown.
3. Select your webhook from the available options.
 4. Complete the rest of your alert configuration and save.
**Sample payload received from the Webhook:**
```json theme={"system"}
{
"event_type": "custom_alert_triggered",
"alert": {
"id": 123123,
"name": "Webhook Test",
"creator": "Last Name, First Name",
"creator_email": "first_name.last_name@example.com",
"project_id": 9876543,
"project_name": "My Prod project",
"fired_at": "2026-02-06T10:53:30Z",
"workspace_id": 12345,
"workspace_name": "All Project Data"
},
"condition": {
"type": "absolute",
"operator": ">",
"threshold": 0,
"current_value": "20,000",
"formatted_value": "20,000",
"sentence": "above 0"
},
"report": {
"name": "Custom Alert Insights Report",
"type": "insights",
"url": "https://mixpanel.com/project/9876543/view/12345/app/insights?mp_source=webhook&alert_id=123123#report/BOOKMARKID"
},
"links": {
"report_url": "https://mixpanel.com/project/9876543/view/12345/app/insights?mp_source=webhook&alert_id=123123#report/BOOKMARKID",
"edit_alert_url": "https://mixpanel.com/settings/account/alert-settings/alert/123123?mp_source=webhook",
"root_cause_analysis_url": "https://mixpanel.com/project/9876543/view/12345/app/boards/?mp_source=webhook#rca=123123&time=1770404010"
}
}
```
{/* SECTION 7: VIEW & MANAGE ALERTS — [UPDATED] */}
{/* New table columns, filters, overflow menu, capacity banner, alert history. */}
{/* ============================================================ */}
## View & Manage Alerts
### Alerts table (Project Settings)
To view and manage all alerts across a project, navigate to **Project Settings > Alerts**. This table gives you full visibility into every alert in the project, with the following columns:
| Column | Description |
| ------------------ | ---------------------------------------------------------- |
| **Creator** | Avatar/initials of the user who created the alert |
| **Last Modified** | Relative timestamp of the most recent edit |
| **Report** | The linked report the alert is monitoring |
| **Triggers** | Total number of times the alert has fired |
| **Last Triggered** | Date of the most recent firing (or `–` if never triggered) |
| **Status** | ✅ Valid or invalid |
**Filtering the table:**
Use the filters in the toolbar to narrow the list:
* **All Creators** — filter by alert creator
* **Report** — filter by associated report
* **All Statuses** — filter by valid or invalid
* **Search** — free-text search by alert name
* **Reset Filter** — clears all active filters
**Row actions:**
Each alert row has a `...` overflow menu with:
* **RCA** — opens a Root Cause Analysis board for that alert
* **Alert History** — opens a side panel with a timestamped log of created, edited, and fired events for the alert
* **Edit Alert** — opens the alert configuration
* **Delete Alert** — permanently removes the alert
**Anomaly Detection capacity warning:**
If your organization is approaching the 50 active Anomaly Detection Alert limit, a blue info banner appears at the top of the table:
> *"Your organization is approaching the limit for active anomaly detection alerts. Delete old anomaly detection alerts to make space for new ones. X/50 alerts used. Y% capacity."*
This banner appears when your org reaches 90% of the limit (45 of 50 alerts). Delete old anomaly detection alerts from this table to free up capacity.
**Managing webhooks:**
Click the **Manage Webhooks** button in the table toolbar to add or edit webhook configurations for alert delivery.
### Editing and deleting alerts
* **To edit** an alert you created, click its name from the bell icon modal in any report, or use the **Edit Alert** option in the `...` menu in Project Settings > Alerts.
* **To delete** an alert, hover over it in the Alerts table and click the **trash icon**, or use the **Delete Alert** option in the `...` overflow menu.
### Alert History
Click **Alert History** from any row's `...` menu to view a side panel showing a full timestamped log of activity for that alert — including when it was created, edited, and each time it fired. This is useful for auditing unexpected behavior or understanding alert patterns over time.
### Permissions
| Scenario | What you can do |
| ------------------------------------------------------------------------ | ------------------------------------------------------------------------------------------ |
| You have **Edit access** to a report | You can create, edit, and delete all alerts on that report — even alerts created by others |
| You **lack Edit access** to a report | You cannot create alerts on that report |
| You **lack Edit access** to a report where someone else created an alert | The alert is view-only; an explanatory banner appears in the UI |
*Note: Permissions are evaluated at the **report level**, not just the project level. If a user can't edit an alert, confirm their access to the underlying report first.*
{/* SECTION 8: ALERT CRITERIA TYPES — [UNCHANGED] */}
{/* ============================================================ */}
## Alert Criteria Types
Alerts can be configured to trigger based on a metric reaching above or below a custom threshold you defined, or through our Anomaly Detection model.
### Custom Threshold
Custom Threshold alerts monitor your metrics and notify you when the metric reaches above or below the threshold that you defined.
* **Above** — the alert fires if the current value is above the set threshold.
* **Below** — the alert fires if the current value is below the set threshold.
* **Increases by more than** — available in line chart reports. Compares the current value with the previous value (based on the report's time-series setting). Fires if the new value has increased by the specified amount or percentage.
* **Decreases by more than** — available in line chart reports. Fires if the new value has decreased by the specified amount or percentage below the previous value.
### Anomaly Detection
Users on the Enterprise plan can create Anomaly Detection alerts. See our [pricing page](https://mixpanel.com/pricing/) for more details.
Anomaly Detection alerts automatically monitor your metrics and notify you when significant anomalies occur. Mixpanel uses advanced forecasting algorithms to calculate expected ranges for your metrics. If a data point falls outside the calculated confidence interval, you'll receive an alert — no manual threshold configuration required.
**Before you begin:**
* Anomaly detection alerts are only available on Insights reports using a time series visualization.
* Anomaly detection is only supported on line charts without comparisons, rolling ranges, cumulative types, or cohorts over time.
* Hourly anomaly detection alerts may produce more false positives due to reduced forecast accuracy at that granularity.
**To set up an Anomaly Detection alert:**
1. Click the **bell icon** in the report header, then click **Create Alert**.
2. Select **Anomaly Detection** as the alert type.
*If Anomaly Detection is unavailable, it is not supported for your current report or chart type.*
3. Optionally adjust the confidence interval to tune sensitivity. Higher confidence intervals produce a wider expected range and fewer alerts.
4. Use the alert preview to fine-tune settings, then configure delivery and save.
### Additional information
**Forecasting tool**
Anomaly Detection uses an LLM forecasting tool designed for time series data. This handles missing data points, trend shifts, and large outliers effectively.
**Confidence interval**
The confidence interval reflects the level of certainty that a detected anomaly represents an unexpected change. Higher confidence levels generally result in fewer anomalies detected.
**Anomaly Detection limit**
Each organization has a limit of 50 active Anomaly Detection Alerts. A warning banner appears in Project Settings > Alerts when your org reaches 90% capacity (45/50). Delete old alerts to create space for new ones.
**Rounding in alert messages**
When displaying decimal values, the current value shown in alert messages is rounded to 2 decimal places. This can make it appear to be outside the alert range when it is very close to the boundary. The actual alert is always checked against the full unrounded value.
{/* SECTION 9: ROOT CAUSE ANALYSIS — [UPDATED] */}
{/* /docs/root-cause-analysis. This section is now just a */}
{/* feature exists. The H2 anchor #root-cause-analysis is preserved */}
{/* mechanics belong on the RCA page, not here. */}
## Root Cause Analysis
When an alert fires, you can launch AI-powered [Root Cause Analysis](/docs/root-cause-analysis) directly from the trigger notification to automatically diagnose what drove the change. See the [Root Cause Analysis](/docs/root-cause-analysis) page for the full feature.
4. Complete the rest of your alert configuration and save.
**Sample payload received from the Webhook:**
```json theme={"system"}
{
"event_type": "custom_alert_triggered",
"alert": {
"id": 123123,
"name": "Webhook Test",
"creator": "Last Name, First Name",
"creator_email": "first_name.last_name@example.com",
"project_id": 9876543,
"project_name": "My Prod project",
"fired_at": "2026-02-06T10:53:30Z",
"workspace_id": 12345,
"workspace_name": "All Project Data"
},
"condition": {
"type": "absolute",
"operator": ">",
"threshold": 0,
"current_value": "20,000",
"formatted_value": "20,000",
"sentence": "above 0"
},
"report": {
"name": "Custom Alert Insights Report",
"type": "insights",
"url": "https://mixpanel.com/project/9876543/view/12345/app/insights?mp_source=webhook&alert_id=123123#report/BOOKMARKID"
},
"links": {
"report_url": "https://mixpanel.com/project/9876543/view/12345/app/insights?mp_source=webhook&alert_id=123123#report/BOOKMARKID",
"edit_alert_url": "https://mixpanel.com/settings/account/alert-settings/alert/123123?mp_source=webhook",
"root_cause_analysis_url": "https://mixpanel.com/project/9876543/view/12345/app/boards/?mp_source=webhook#rca=123123&time=1770404010"
}
}
```
{/* SECTION 7: VIEW & MANAGE ALERTS — [UPDATED] */}
{/* New table columns, filters, overflow menu, capacity banner, alert history. */}
{/* ============================================================ */}
## View & Manage Alerts
### Alerts table (Project Settings)
To view and manage all alerts across a project, navigate to **Project Settings > Alerts**. This table gives you full visibility into every alert in the project, with the following columns:
| Column | Description |
| ------------------ | ---------------------------------------------------------- |
| **Creator** | Avatar/initials of the user who created the alert |
| **Last Modified** | Relative timestamp of the most recent edit |
| **Report** | The linked report the alert is monitoring |
| **Triggers** | Total number of times the alert has fired |
| **Last Triggered** | Date of the most recent firing (or `–` if never triggered) |
| **Status** | ✅ Valid or invalid |
**Filtering the table:**
Use the filters in the toolbar to narrow the list:
* **All Creators** — filter by alert creator
* **Report** — filter by associated report
* **All Statuses** — filter by valid or invalid
* **Search** — free-text search by alert name
* **Reset Filter** — clears all active filters
**Row actions:**
Each alert row has a `...` overflow menu with:
* **RCA** — opens a Root Cause Analysis board for that alert
* **Alert History** — opens a side panel with a timestamped log of created, edited, and fired events for the alert
* **Edit Alert** — opens the alert configuration
* **Delete Alert** — permanently removes the alert
**Anomaly Detection capacity warning:**
If your organization is approaching the 50 active Anomaly Detection Alert limit, a blue info banner appears at the top of the table:
> *"Your organization is approaching the limit for active anomaly detection alerts. Delete old anomaly detection alerts to make space for new ones. X/50 alerts used. Y% capacity."*
This banner appears when your org reaches 90% of the limit (45 of 50 alerts). Delete old anomaly detection alerts from this table to free up capacity.
**Managing webhooks:**
Click the **Manage Webhooks** button in the table toolbar to add or edit webhook configurations for alert delivery.
### Editing and deleting alerts
* **To edit** an alert you created, click its name from the bell icon modal in any report, or use the **Edit Alert** option in the `...` menu in Project Settings > Alerts.
* **To delete** an alert, hover over it in the Alerts table and click the **trash icon**, or use the **Delete Alert** option in the `...` overflow menu.
### Alert History
Click **Alert History** from any row's `...` menu to view a side panel showing a full timestamped log of activity for that alert — including when it was created, edited, and each time it fired. This is useful for auditing unexpected behavior or understanding alert patterns over time.
### Permissions
| Scenario | What you can do |
| ------------------------------------------------------------------------ | ------------------------------------------------------------------------------------------ |
| You have **Edit access** to a report | You can create, edit, and delete all alerts on that report — even alerts created by others |
| You **lack Edit access** to a report | You cannot create alerts on that report |
| You **lack Edit access** to a report where someone else created an alert | The alert is view-only; an explanatory banner appears in the UI |
*Note: Permissions are evaluated at the **report level**, not just the project level. If a user can't edit an alert, confirm their access to the underlying report first.*
{/* SECTION 8: ALERT CRITERIA TYPES — [UNCHANGED] */}
{/* ============================================================ */}
## Alert Criteria Types
Alerts can be configured to trigger based on a metric reaching above or below a custom threshold you defined, or through our Anomaly Detection model.
### Custom Threshold
Custom Threshold alerts monitor your metrics and notify you when the metric reaches above or below the threshold that you defined.
* **Above** — the alert fires if the current value is above the set threshold.
* **Below** — the alert fires if the current value is below the set threshold.
* **Increases by more than** — available in line chart reports. Compares the current value with the previous value (based on the report's time-series setting). Fires if the new value has increased by the specified amount or percentage.
* **Decreases by more than** — available in line chart reports. Fires if the new value has decreased by the specified amount or percentage below the previous value.
### Anomaly Detection
Users on the Enterprise plan can create Anomaly Detection alerts. See our [pricing page](https://mixpanel.com/pricing/) for more details.
Anomaly Detection alerts automatically monitor your metrics and notify you when significant anomalies occur. Mixpanel uses advanced forecasting algorithms to calculate expected ranges for your metrics. If a data point falls outside the calculated confidence interval, you'll receive an alert — no manual threshold configuration required.
**Before you begin:**
* Anomaly detection alerts are only available on Insights reports using a time series visualization.
* Anomaly detection is only supported on line charts without comparisons, rolling ranges, cumulative types, or cohorts over time.
* Hourly anomaly detection alerts may produce more false positives due to reduced forecast accuracy at that granularity.
**To set up an Anomaly Detection alert:**
1. Click the **bell icon** in the report header, then click **Create Alert**.
2. Select **Anomaly Detection** as the alert type.
*If Anomaly Detection is unavailable, it is not supported for your current report or chart type.*
3. Optionally adjust the confidence interval to tune sensitivity. Higher confidence intervals produce a wider expected range and fewer alerts.
4. Use the alert preview to fine-tune settings, then configure delivery and save.
### Additional information
**Forecasting tool**
Anomaly Detection uses an LLM forecasting tool designed for time series data. This handles missing data points, trend shifts, and large outliers effectively.
**Confidence interval**
The confidence interval reflects the level of certainty that a detected anomaly represents an unexpected change. Higher confidence levels generally result in fewer anomalies detected.
**Anomaly Detection limit**
Each organization has a limit of 50 active Anomaly Detection Alerts. A warning banner appears in Project Settings > Alerts when your org reaches 90% capacity (45/50). Delete old alerts to create space for new ones.
**Rounding in alert messages**
When displaying decimal values, the current value shown in alert messages is rounded to 2 decimal places. This can make it appear to be outside the alert range when it is very close to the boundary. The actual alert is always checked against the full unrounded value.
{/* SECTION 9: ROOT CAUSE ANALYSIS — [UPDATED] */}
{/* /docs/root-cause-analysis. This section is now just a */}
{/* feature exists. The H2 anchor #root-cause-analysis is preserved */}
{/* mechanics belong on the RCA page, not here. */}
## Root Cause Analysis
When an alert fires, you can launch AI-powered [Root Cause Analysis](/docs/root-cause-analysis) directly from the trigger notification to automatically diagnose what drove the change. See the [Root Cause Analysis](/docs/root-cause-analysis) page for the full feature.